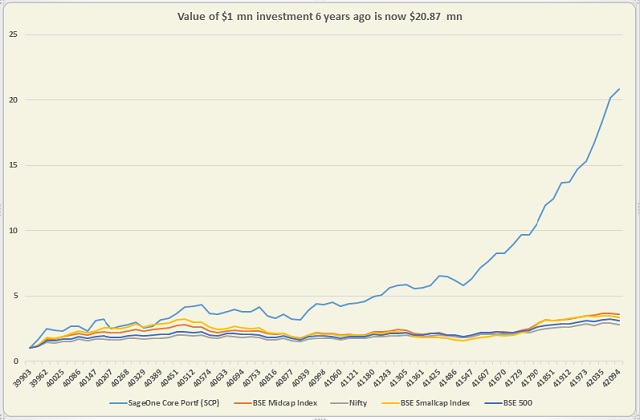
- We measure our performance using a “representative” portfolio and we call it SageOne Model Portfolio.
- SageOne Model Portfolio is not a dummy portfolio but an actual portfolio managed by the CIO since the end of 2008.
- This is the portfolio used to advise clients and their individual performance should cling to this model portfolio performance depending on the timing of their actual buys.
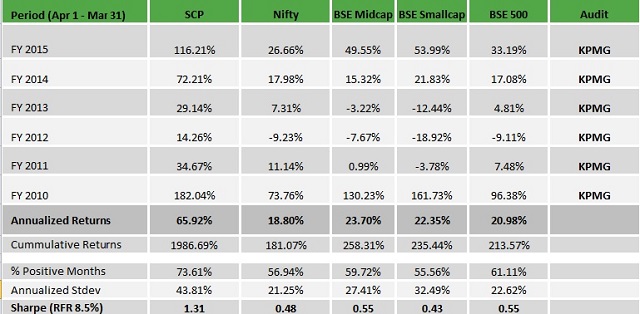
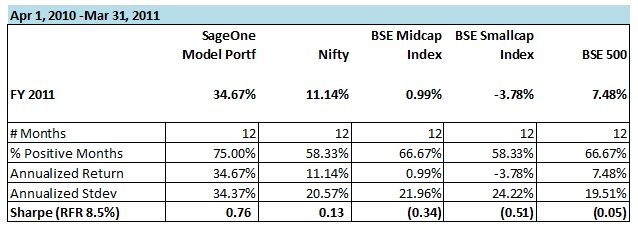
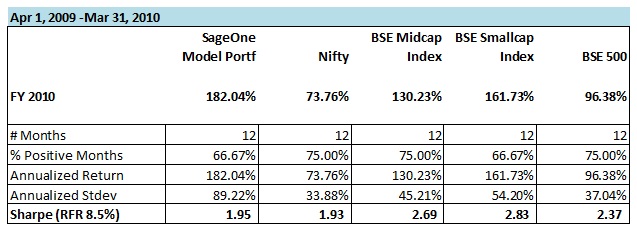
- We are agnostic to size and benchmark our performance against the broad Indian market index such as Nifty or the BSE 500. We usually find value in the small to mid-cap space and hence have also provided comparison against indices tracking that space.
- The returns detailed in the tables below are without dividends, transaction costs and management fees.
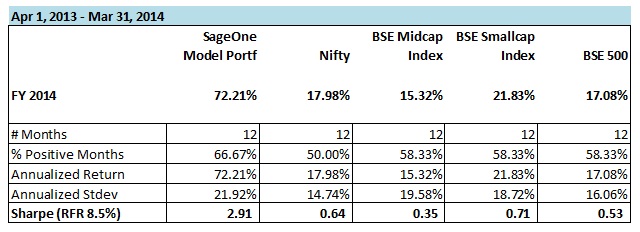
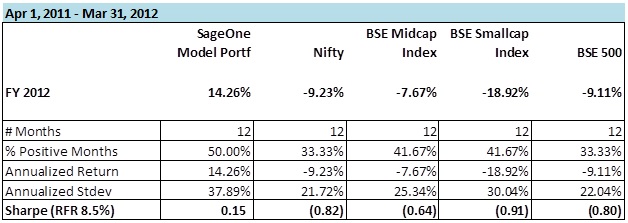
- As we started seriously advising clients over the past 3 years, we have consciously changed the composition of the model portfolio over time in terms of average size, number of stocks and quality of business. The weighted average size of stocks at the start in FY09 was 1000 crs which has increased to above 5500 crs in FY14. Also number of stocks have increased from 5-6 in FY09 to 14 (+/- 2) during the past 3 years. This was done by design to reduce volatility especially on the downside in the portfolio. The resulting improvement in risk adjusted returns over time can be seen in the tables below.
- Below are some of the risk measure we have employed currently in advising portfolios for our clients:
- Generally less than 10% (at cost) of the portfolio in one stock. Only in extremely rare cases where the opportunity is exceptionally attractive, we increase this cap to 15%.
- Minimum of 12 and maximum of 16 stocks at any given point in any portfolio.
- Less than 25% of portfolio in one/closely related sector/s.
- Less than 20% of portfolio in one business group.