
Dear Investors,
I am pleased to share our new note as part of our ‘Knowledge Series’ initiative. In the previous note, my colleague Dushyant, very well-articulated the concept of ‘Hydrogen’ and its use as fuel for mobility. I am sure there were a few takeaways for each one of you from the same.
The idea of penning down a fresh note came from the last investor webinar that our CIO, Samit Vartak had with you, where there were a couple of questions asked on the concept of Return on Capital Employed (ROCE) and the difference between ROCE and ROIC (Return on Invested Capital). Therefore, in this note, I have attempted to decipher the concept of ROCE, ROIC and ROE (Return on Equity) and the relevance of each metric in the investing world. In the end, have also exemplified the concept in relation to SageOne’s portfolio construct.
Return on Capital Employed (ROCE):
ROCE is a profitability ratio that measures how efficiently a company uses its Total Capital to generate profits.
The formula goes as follows:
ROCE = NOPAT / Capital Employed
where –
- NOPAT – Net Operating Profit after Tax. NOPAT = PAT + Interest – Tax Shield or EBIT (1-Tax)
- Capital employed – Total Equity (Shareholders fund) + Debt
Key Learnings:
→ Some ratios are just from Profit & Loss Account (like operating profit margins and net profit margins) while some are from Balance Sheet (like Debt to Equity). ROCE combines the two by incorporating numerator from P&L and denominator from BS.
→ ROCE answers a very important question that what returns does one get by putting money into that particular business.
→ If one observes, the numerator we have used for calculating ROCE is NOPAT. In most cases, you would find EBIT as a numerator. At SageOne, we prefer to use NOPAT instead of EBIT because NOPAT is a post-tax number. ROCE is generally compared to WACC which is a post-tax number. Else, we are comparing apples to oranges. Also, when there is no debt in a company, the ROCE and ROE number should be the same and ROE uses PAT in the numerator which is also a post-tax number.
→ A higher is favorable, as it indicates a higher efficient use of capital employed in the business. The figure needs to be compared with previous years to see if the trend in ROCE is trending upwards or downwards.
→ This metric should be used for comparing companies from same industry. Comparing across different industries may offer little value.
→ Capital intensive sectors like Oil & Gas, steel, telecom, need a lot of capital. A big portion of this capital is financed by debt. A higher debt artificially elevates the ROE. Thus, ROCE works better in capital intensive cos as it assumes debt in the calculation.
→ ROCE should always be higher than WACC (weighted average cost of capital). A company with WACC higher than ROCE indicates a negative return (means company is losing money for every INR it invests in the company).
→ High amounts of cash leads to lower ROCE while decrease in equity shareholding can lead to higher ROCE. Thus, an investor should pay attention to reason behind any abnormal increase in ROCE.
→ ROCE measures assets on book value and assets can be easily overvalued and undervalued in balance sheet. This in turn leads to increase/decrease in ROCE without any changes in profitability. This is usually seen in businesses with high depreciating assets. Investors need to be aware of any such changes in asset value.
→ While a higher ROCE is desirable, an investor should look at ROCE in conjunction with other ratios while evaluating a company – like profitability, Debt to Equity, ROE, etc.
Return on Equity (ROE):
ROE measures the ability of a firm to generate profits from shareholder’s investments. In other words,
ROE shows efficiency of a company in terms of generating profits to its shareholders. ROE can be calculated as:
ROE = PAT / Shareholders Fund
where –
- PAT – Profit after Tax
- Shareholder’s fund – Equity Capital + Reserves.
Key Learnings:
→ A higher ROE number is a positive sign for investors.
→ ROE can be inflated by increasing debt. Similarly, reducing equity, primarily via share buyback also increases ROE as the shareholders fund (denominator in the above formula, reduces).
→ This ratio should be compared with other companies in the same industry and observed over time.
Let’s understand this better with the help of an example:
Assume Mr.X runs a Pizza store. To make Pizza, Mr.X requires an oven which costs him INR 10,000. He procures this oven with his own funds without taking any external debt. Thus, one would agree on his balance sheet, that his Shareholders Equity (fund) is INR 10,000 and equivalent asset is INR 10,000. Now, let’s assume Mr.X earns profit of INR 2,500 in his first year of operations. So, his ROE computation shall be
ROE = (2500 / 10000) *100
= 25%
The ROCE in this case will be the same as ROE, as Total Capital Employed is equal to the Shareholders Equity.
Now, let’s look at a different scenario. Mr.X only has INR 8,000 and he borrows INR 2,000 from his friend to make the purchase of the oven costing INR 10,000.
Now, the liability side of his balance sheet would look something like this:
- Shareholders Equity (fund) – INR 8,000;
- Debt – INR 2,000
The ROE in this case would be computed as follows –
ROE = (2500 / 8000) * 100
= 31.25%
Please note, the ROCE will remain the same 25% as above as Total Capital Employed (Equity + Debt) is still INR 10,000. Thus, while ROE is 31.25%, the ROCE is 25%
Thus, with additional debt, the ROE shot up significantly. Similarly, if Mr.X financed his purchase with INR 5,000 own equity and INR 5,000 as debt, the ROE would be –
ROE = (2500 / 5000) * 100
= 50%
However, in this case also, the ROCE will still remain at 25%.
The above example clearly infers that, higher the debt, higher the ROE. However, it’s not always advisable to carry high amount of debt on ones’ balance sheet, as high debt makes it a risky proposition to run the business with all the finance cost (interest on debt) to be paid, especially if it’s a cyclical business as servicing such high amounts of debt in a down cycle becomes extremely difficult. Ability to service debt is key.
Please note, for financials sector companies, we arrive at valuations based on ROE rather than ROCE. The main reason being the core to any finance business is mobilization of funds (i.e. the key raw material) and therefore most of the banks and NBFCs would be highly leveraged (anywhere from 3x to 10x generally).
This brings us to a very interesting concept of the DuPont Model. The DuPont model breaks down the ROE formula into 3 parts –
ROE =
Net Profits/ Net Sales
x
Net Sales/ Avg. Total Assets
x Avg. Total Assets/ Shareholders Equity
If you notice the above formula, the denominator and the numerator cancel each other out, leaving you eventually with the ROE formula.
From the above, we can gain insight into three distinct aspects of a business –
- Net Profit Margin = (Net Profit / Net Sales) * 100 – this is normal Profit after Tax margin of a business. It expresses the ability of a company to generate profits.
- Asset Turnover = Net Sales / Avg.Total Assets – Asset Turnover ratio is an efficiency ratio that indicates how efficiently a company is using its assets to generate revenues. Higher the ratio, means company is using its assets more efficiently. The resulting figure is expressed as several times per year.
- Financial leverage = Avg.Total Assets / Shareholders Equity – indicates units of assets a company has for every unit of shareholders equity. The resulting figure is expressed as several times per year. For instance, if financial leverage is 2, it implies for every Rs.1 of equity, the company supports assets worth Rs.2. Thus, the remainder is financed via debt.
Return on Invested Capital (ROIC):
ROIC is a profitability ratio that measures percentage returns a company earns over its invested capital. It shows how efficiently a company is allocating its investors funds to generate profits. Any return on invested capital (ROIC) higher than the company’s weighted average cost of capital (WACC) implies the company is allocating its resources efficiently.
ROIC is calculated as follows:
ROIC = NOPAT / Invested Capital
where –
- NOPAT – Net operating profit after tax (operating profits is basically EBIT. We add back the interest component to PAT and arrive at NOPAT)
- Invested capital – Equity + Debt
Key Takeaways:
→ In normal scenario, the main difference between ROCE and ROIC would be the numerator calculation. While ROCE would use EBIT, ROIC uses NOPAT, which is PAT plus interest. NOPAT can be calculated as EBIT*(1-effective tax rate). But at SageOne and as mentioned above, we use NOPAT as numerator for ROCE as well. Thus, for us, the difference between the two ratios would be insignificant.
→ ROIC is mainly used by companies for their internal calculation to arrive as viability of a new project or capex to gauge the kind of incremental returns they can expect from this new investment.
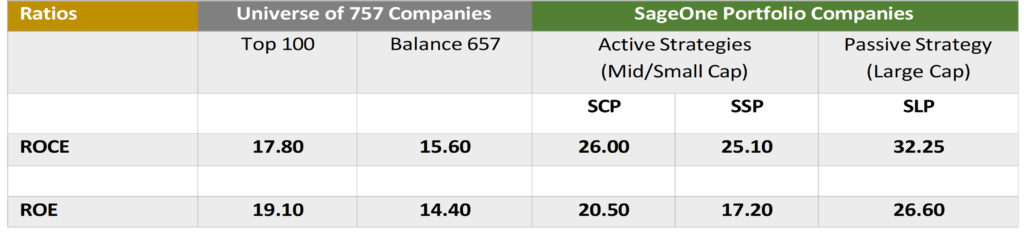
Let’s look at the ROCE and ROE for companies filtered on the basis of Market Capitalization > 1000cr and compare them with SageOne portfolio companies (excluding Financial and Real Estate companies)
Source: Screener.in
Note: We have considered the median number for both ratios – for the Universe and SageOne Portfolio companies. This was done to avoid any extreme numbers on either side that could skew the ratios if we had considered averages.
Key Observations from the table above:
→ Universe of 757 Companies
• The top 100 companies by market cap (Large Cap) registered a ROCE of 17.8% and a ROE of 19.1% for FY21.
• The balance 657 companies, which form part of the Mid and Small Cap space registered ROCE of 15.6% and ROE of 14.4% for FY21.
• We have taken the median
→ SageOne Portfolio Companies
• SageOne Core Portfolio or SCP registered a ROCE of 26% and ROE of 20.50% for FY21. As we observe, ROCE and ROE for SCP companies is far higher than the universe under consideration suggesting superior choice of companies for our portfolio.SageOne Small Portfolio or SSP registered ROCE of 25.10% and ROE of 17.20%. Thus, even for our SSP companies, the said ratios are much higher than the universe.
• SageOne LargeCap Portfolio or SLP saw ROCE of 32.25% and ROE of 26.60%. This is significantly higher than the ratios of the top 100 companies as mentioned above.
In summary, ROCE and ROE are very important ratios that we at SageOne consider while studying any company for potential investment. Our goal is to select companies where ROCE is greater than 20%. However, ROCE is just one of the many metrices that are considered. Thus, it’s not necessary that a company with ROCE > 20% will be a part of SageOne portfolio but it surely ticks one of our check boxes.
We hope we have been able to communicate the concept of ROCE, ROE and ROIC successfully and that you would now be able to appreciate the importance of these metrices in selection of a company for investment better than before.
We look forward to hearing from you for your valuable feedback and suggestions on this initiative of ours and on our part, we shall continue to take up interesting topics to help educate you further and in turn learning from you via your feedback. We hope you enjoy reading this note.
Warm Regards,
Parin Gala,
Vice President – Research & Fund Accounting
SageOne Investment Managers LLP
Legal Information and Disclosures
Any performance related information provided above is not verified by SEBI.
This note expresses the views of the author as of the date indicated and such views are subject to changes without notice. SageOne has no duty or obligation to update the information contained herein. Further, SageOne makes no representation, and it should not be assumed, that past performance is an indication of future results.
This note is for educational purposes only and should not be used for any other purpose. The information contained herein does not constitute and should not be construed as an offering of advisory services or financial products. Certain information contained herein concerning economic/corporate trends and performance is based on or derived from independent third-party sources. SageOne believes that the sources from which such information has been obtained are reliable; however, it cannot guarantee the accuracy of such information or the assumptions on which such information is based.