
Dear Investors,
Indian markets had a tough FY16 (Apr 1, 2015 – Mar 31, 2016) as progress on the ground lagged the high expectations priced into the markets. Earnings (ex-financials and crude as presented in the analysis that follows in this newsletter) declined for the first three quarters of the year when compared to the same period a year ago. The fourth quarter of FY16 seems to indicate stabilization (turnaround?) after a long period of deterioration over multiple quarters. In the succeeding sections, we will dig a bit deeper to analyze signs of changing trend. We will finish this letter by talking about our portfolio strategy and positioning. Before we do that, our performance is presented below.
Portfolio Performance*
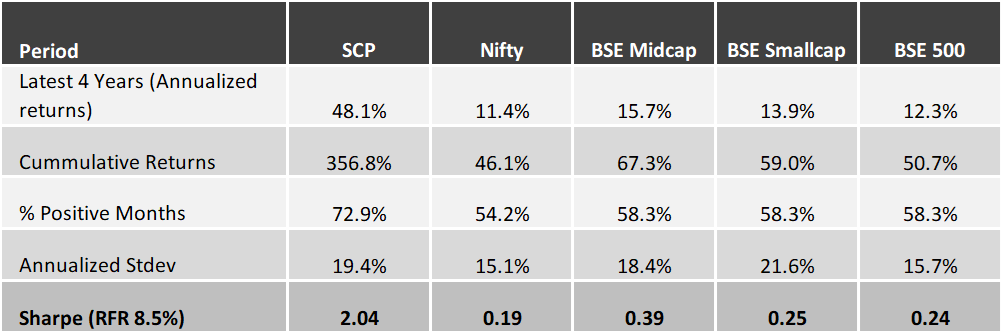
Below is the gross (pre-fees and excluding dividends) performance of our core portfolio in INR terms for the last 7 years. For the first three years we managed proprietary funds and for the last 4 years we have been advising external clients. Since clients have joined at various stages, individual performance may differ slightly based on the timing of purchases. For uniformity and ease we measure our performance using a “representative” portfolio (that resembles advice given to clients) and we call it SageOne Core Portfolio (SCP). SageOne core portfolio is not a dummy portfolio but the CIO’s actual total equity portfolio.
7 Years Performance (April 2009 – Mar 2016)
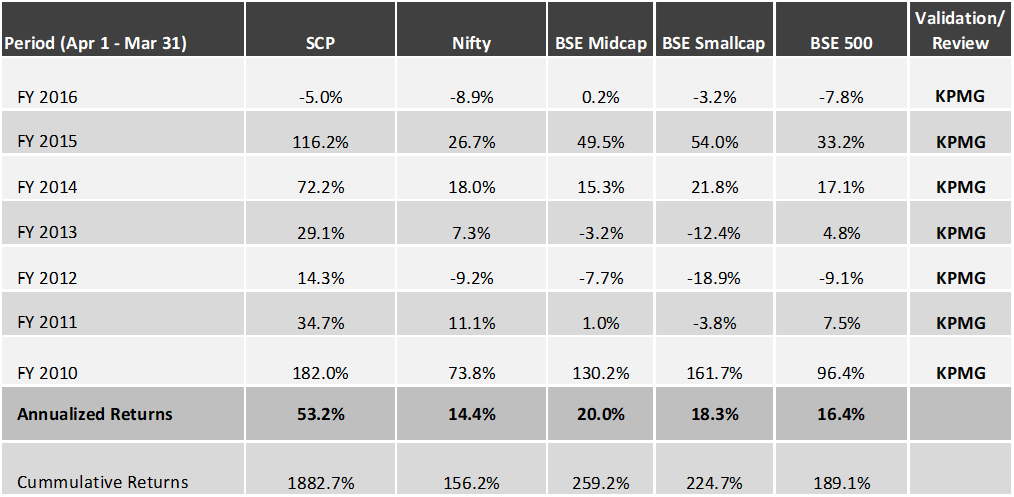
*Note: For detailed risk parameters and composition of the portfolio, please refer to the appendix at the end of this letter
Even though we have outperformed the Nifty as well as the broader BSE 500 indices for FY16, we would be the first to admit that we are not happy with the absolute returns. Add to that almost 6% depreciation in the currency and our gross absolute returns in USD terms move into negative double digits. We had a really good FY15 (116% returns) and the portfolio significantly outperformed in the second half of FY15 (52% vs 6.6% for Nifty). Nearly half of this outperformance was due to just couple of stocks going up multifold, probably running well ahead of fundamentals. These same stocks gave up major part of the run up during FY16. In effect, without the round trip (price wise) of these stocks, our FY15 returns would have been 20% lower and FY16 would have been 20% higher leaving the 2 year rolling average the same.
We have seen that stocks run up in spurts and sometimes these spurts are fast and furious. Key question is, when you like a business over the long run, but for short periods they run up a bit too much, do you get out and get in later hoping better re-entry points? Timing the market or the stock isn’t our strength and hindsight is always very clear, but we don’t believe we can improve too much on that front. We have done a really good job at aggressive exits when business fundamentals have deteriorated, but have never been able to do temporary exits for businesses about which we are excited for the long run.
Fundamentally our portfolio of businesses have delivered well above 20% earnings growth (for FY16) when during the same period markets have delivered negative growth.
Since the start of 2016 (Jan), we have added 5 new stocks to our representative portfolio and exited 2 where valuations had reached uncomfortable levels. These additions were businesses we have been following for some time and after a long patient wait we were able to buy them at valuations that were attractive. Post addition of the new businesses, the cash level in the representative portfolio has reduced from 20% in Jan’16 to single digit currently. We are excited about these businesses and their valuations even though at the broader market level we are still uncomfortable with the valuations. In the next letter, we plan to update our valuation analysis after balance sheets of most companies are available. Below are few of the key parameters of our portfolio as of May 2016.
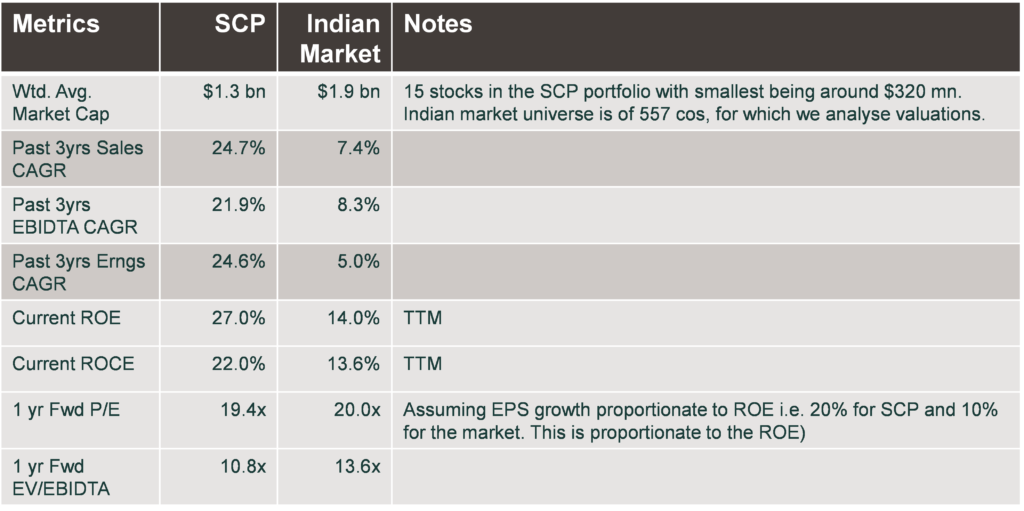
Source: AceEquity, Bloomberg
Notes: Data as of May 22, 2016 for the latest portfolio companies. All ratios and averages are weighted by percentage allocation in the portfolio. Valuation ratios exclude one pharma stock, since it is an R&D firm wherein these valuation multiples are not appropriate.
Was this quarter a turnaround?
Generally we do not give too much relevance to quarterly trend and focus more on the longer term trend in our businesses. This time we have given it a closer look to provide broader support to anecdotal evidences of demand pick up which we are witnessing in some businesses and sectors that we track closely. We are bottoms up stock pickers and even though above macro trend is not very relevant in that aspect, it surely helps in position sizing.
Often growth numbers look good due to base effect and/or shift of pent up demand from previous quarters, trend can be better analyzed by looking from multiple perspectives. The universe that we have used is the same that we considered for our annual valuation analysis. Following are the details and exclusions:
Total Universe: The starting universe for the Valuation analysis comprised all the companies (872) in the BSE 500, BSE Midcap and BSE Small Cap indices. After excluding companies who do not have 14 years of listed history, we were left with 557 companies. This universe covered about 80% of the total listed market capitalization. In the current analysis, we have further excluded the following sectors/companies: Financial sector, Crude Oil sector and specific companies Tata Steel, Vedanta and Suzlon due to large exceptional items that would skew the overall results.
Source of all data: Ace Equity
Quarterly trend over the past 9 quarters (consolidated for the analyzed companies)
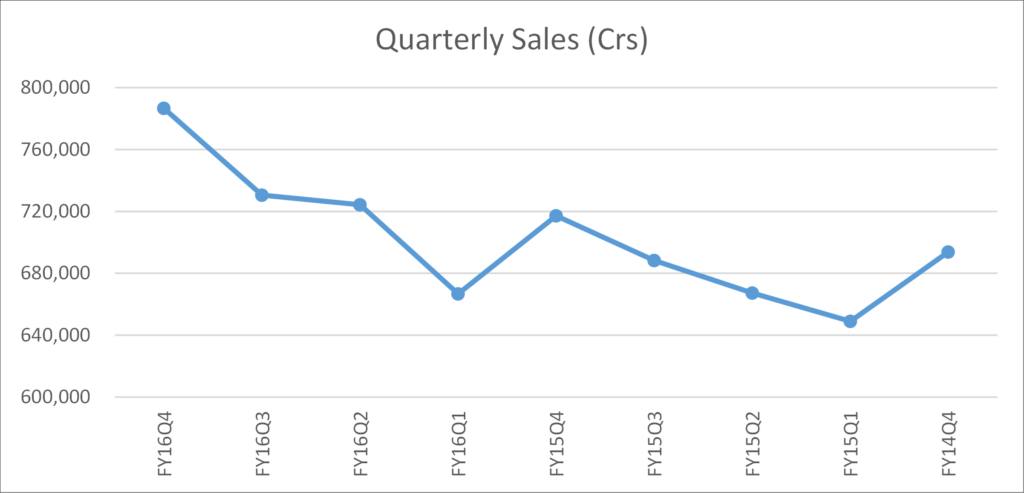
Absolute level of sales are well above the same quarters for the last 2 years as well as any quarter during the last 2 years. Year on year as well as absolute trend is upwards, which is supportive of demand pickup considering that the wholesale price inflation (WPI) was negative for 17 consecutive quarters.
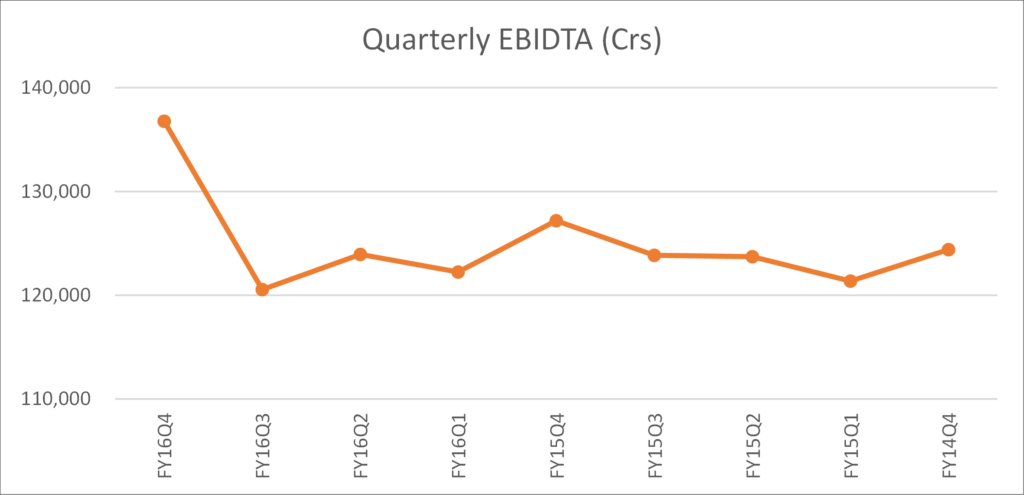
EBIDTA trend would have been similar if margins were sustained. They dropped from a level of 18-18.5% during Q2/Q3 of FY15 to 16.5-17% during the same quarters for FY16. This is an indication that most commodity benefits were passed on to the consumer, as the capacity utilization lingered near 70%, which is at multiyear lows.
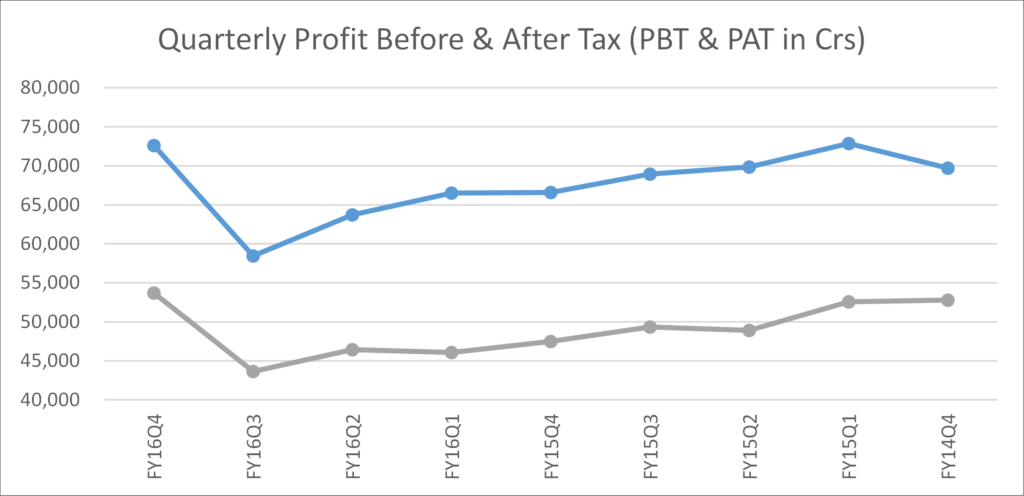
PBT & PAT followed similar trend until Q3FY16 as reducing capacity utilization had negative impact on net margins due to operating deleverage. In Q4FY16 Net margins have shown signs of improvement mainly due to capacity utilization picking up with demand as seen in the sales trend.
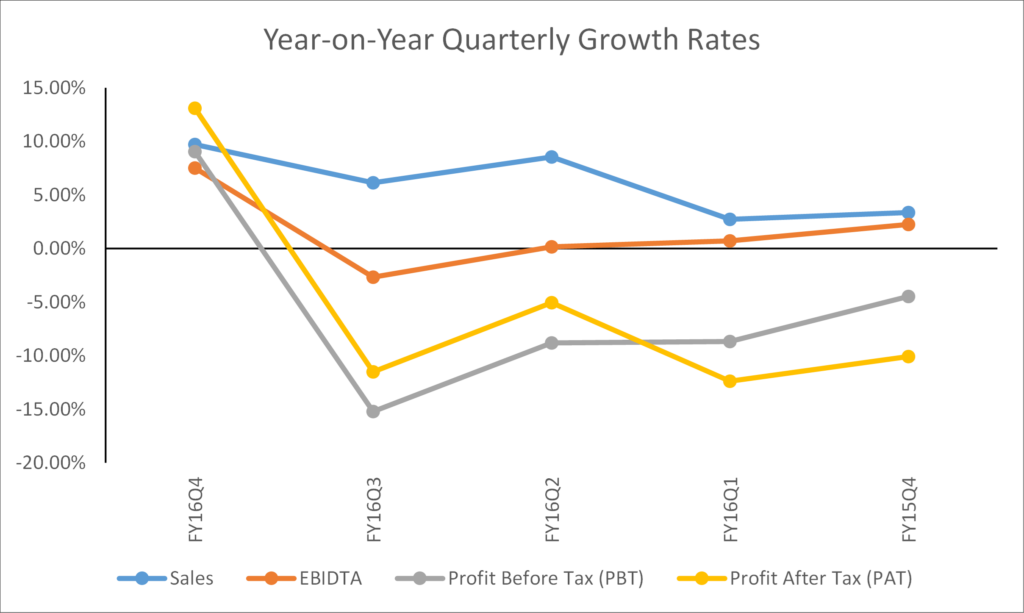
Adjoining chart shows that sales trend has been positive throughout, but with declining margins the profits have been showing negative growth. Now after multiple quarters growth trend has turned positive for all parameters. Below is a common size Profit & Loss statement for the analyzed universe, which provides good sense of items impacting margins at various levels over the past 9 quarters.
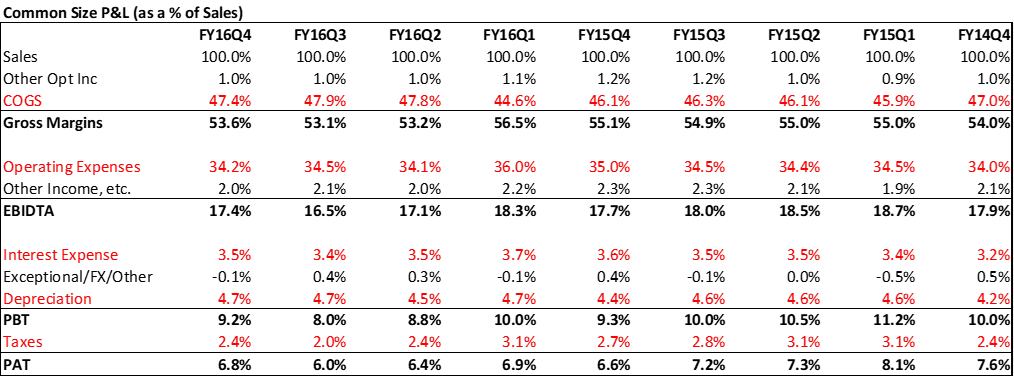
Above table shows that the current margins (GM, EBIDTA as well as PBT/PAT) are well below the historically low levels seen during the last 2 years. During times (FY06-FY08) when capacity utilization was above 90%, net margins (PAT) had reached levels above 11% vs 6.83% for the latest quarter. As I have written in great detail in my October 2015 newsletter (October 2015 Newsletter), when capacity utilization picks up, operating leverage drives tremendous bottom-line growth even with slow top-line pick up.
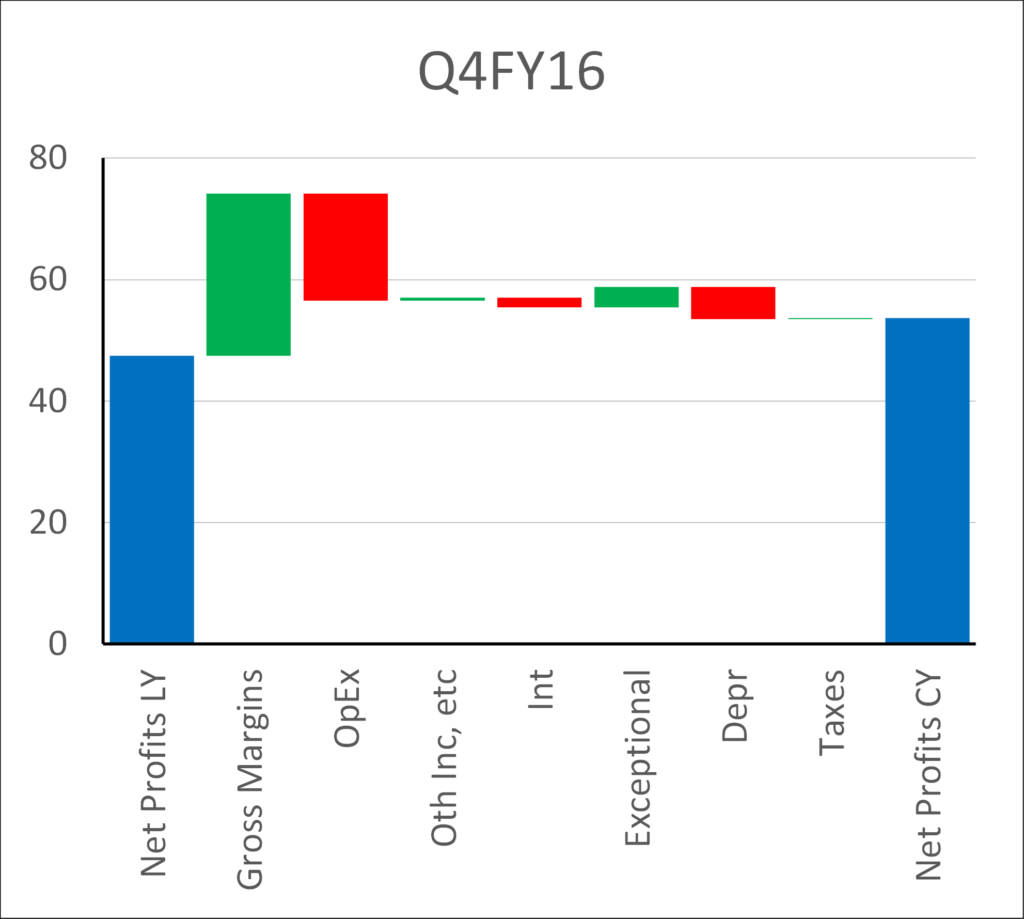
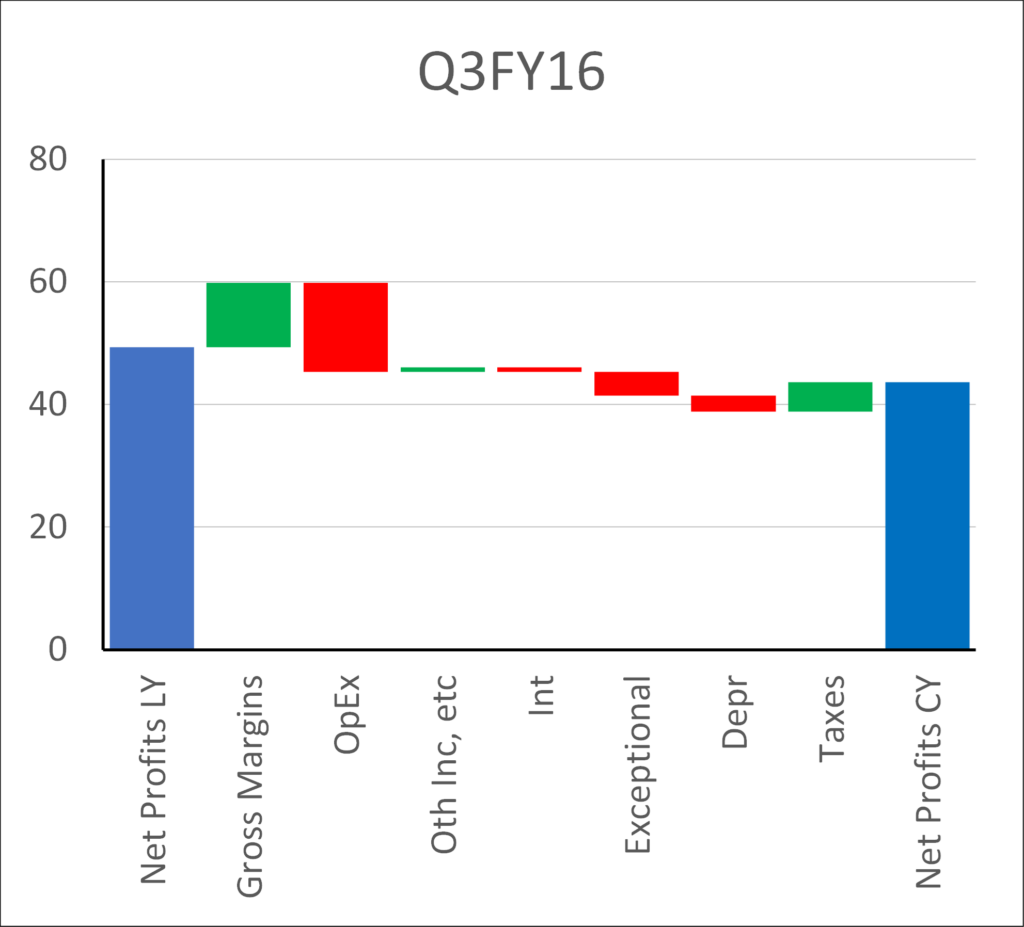
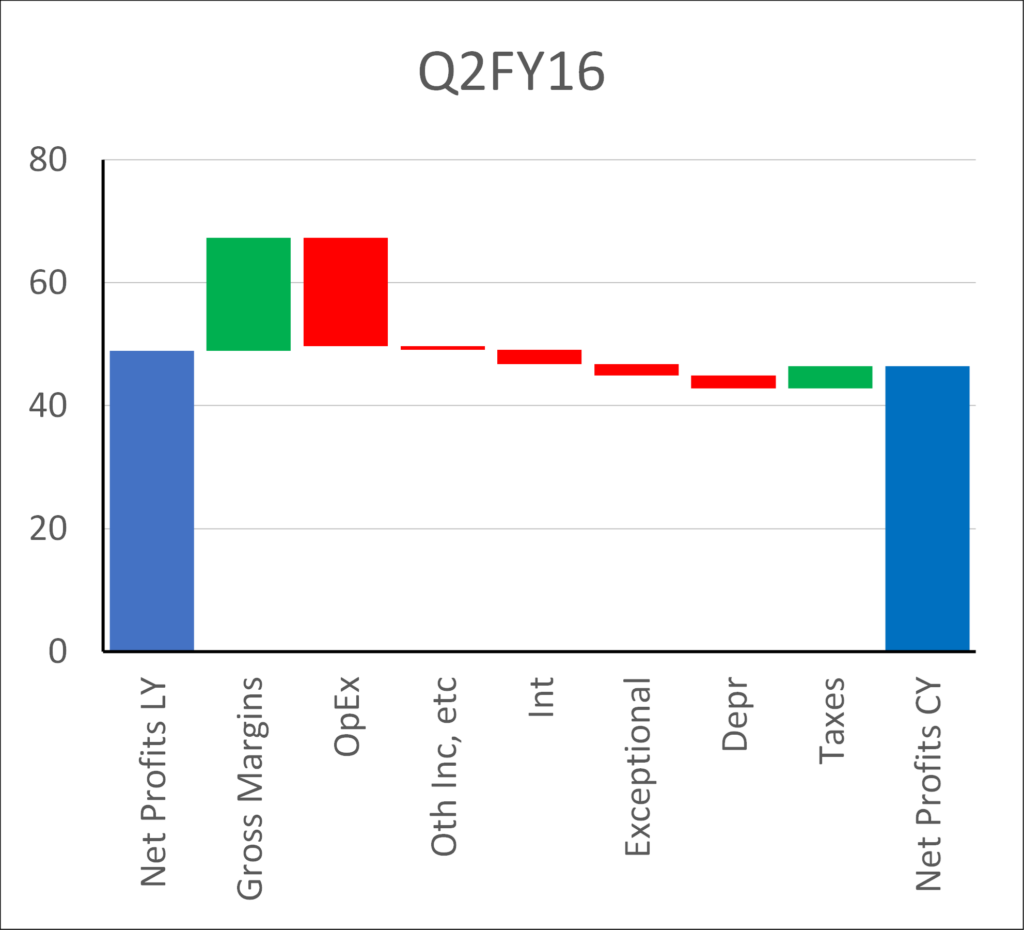
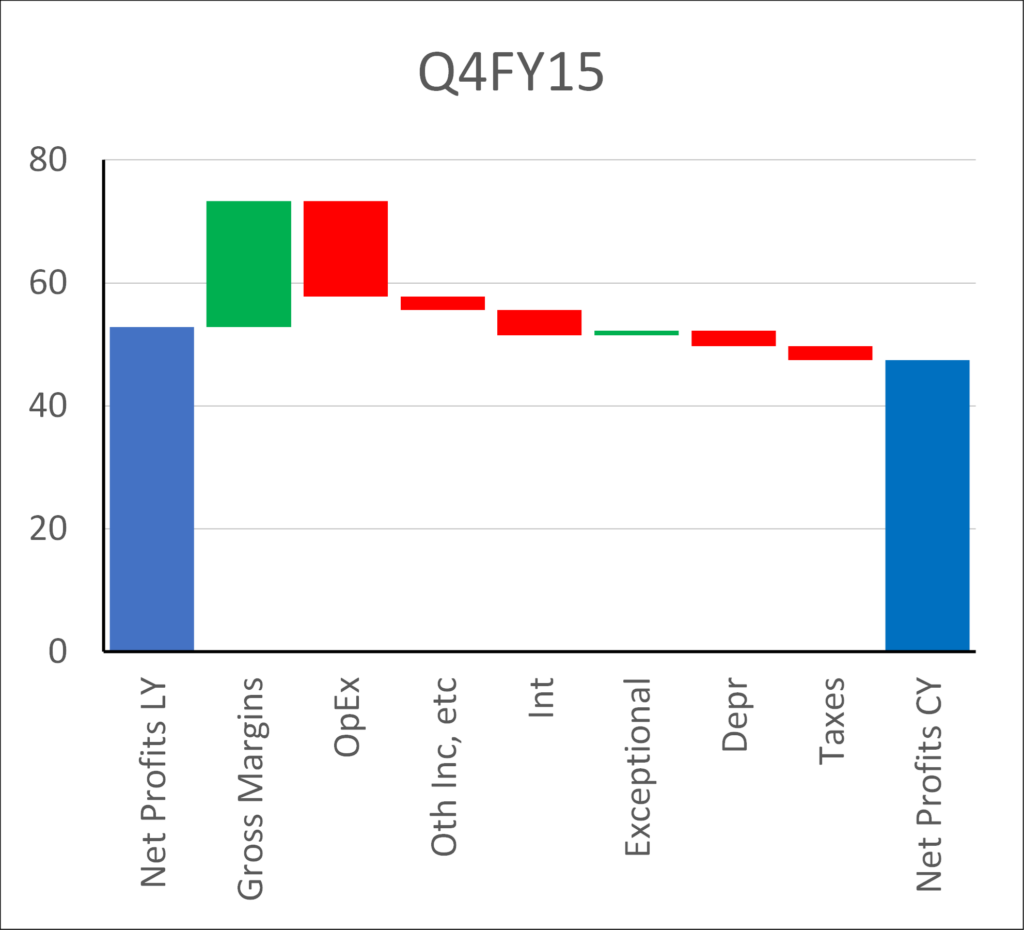
To complete the quarterly analysis, here are a series of waterfall charts showing components contributing to growth in current year PAT (rightmost Blue tower) vs same quarter last year (leftmost Blue tower). Green bar means contributing to profits, whereas Red to expenses. For Q4FY16, increase in GM wasn’t negated by increase in expenses and hence PAT grew. During previous 4 quarters, growth in GM was weak and not enough to compensate for the growth in non-variable operating expenses (opex), interest and depreciation. Hence PAT decreased Y-o-Y.

Conclusion
One quarter doesn’t make a trend, but there are various macro and corporate indicators supporting pickup in demand situation. Following are few of them:
→ Growth in electricity production, cement production, port volume, two-wheelers sales, heavy & medium/light commercial vehicles sales, construction equipment sales, oil consumption, Naukri job index, etc.
→ WPI has turned positive for April as well as May after a gap of 17 consecutive negative months. This is an indication that companies are able to raise prices, which is a sign of improving demand. Nominal GDP had fallen to mid-single digits compared to historical average of 13-14%. A positive WPI should help going forward.
→ Out of the 35 sectors that are part of the analysis, 17 sectors have grown sales at double digits compared to 10 or lower during each of the last 4 quarters. Top growth sectors include consumer durables, hospitality, media, retail, automobiles, healthcare, diamonds/jewellery, IT, chemicals etc. The breadth of sectors shows quality of growth.
Risks to the Conclusion
Of course not all is good. Exports have been weak as they have fallen to 20% of GDP in 2015 vs 25% it had reached in 2013. One has to be careful while concluding that corporate growth indicates final consumption pickup. Many a times restocking by dealers and wholesalers can drive growth in the short term in some sectors. E.g. our anecdotal checks in 4 wheelers indicate buildup of inventory at dealer level. Private capital expenditure cycle is weak and public sector bank balance sheets are vulnerable. Credit growth has reached single digits.
Portfolio Strategy and Positioning
Given the global growth/deflationary environment and extremely weak balance sheets of Indian creditors (representing more than 2/3rd of loan book) the broad based corporate top-line growth as well as nominal GDP growth isn’t going to reach anywhere close to what we saw in the last bull cycle of 2003-2007. Many of the structural changes that India is currently undergoing (or on the verge of undergoing) such as GST (goods and service tax bill), DBT (direct benefit transfer), reduction in corruption, lack of availability of easy money/credit to undeserving corporates are geared towards improving efficiency and/or improving capital allocation. GST will transfer market share from the hundreds of small unorganized players to the well run organized corporates. DBT will reduce leakages (generation of black money) from the system resulting in money reaching the deserving families. This money will be spent on the products that they need rather than money hiding in idle/nonproductive assets. With reduction in crony capitalism and easy credit, businesses which are well and efficiently managed will disproportionately benefit as the historically favored groups will find it difficult to survive or compete effectively. We believe that these well and efficiently managed businesses who have expanded (or are expanding) capacity without too much leverage will go through long periods of high growth.
With changing times, newer themes emerge in every business cycle. Patience and ground research is of utmost importance to catch the upcoming game changing trends. That’s the job of a long term investor and that’s what we intend to keep doing. If one is able to catch the right structural trend and identify appropriate investment themes, opportunity is tremendous. There are too many moving parts across the globe and too many disruptive forces around to destroy weak companies and industries. Add to that the valuation risk. It is not the time to bet on everything, but be extremely targeted and focused.
Warm Regards,
Samit S. Vartak, CFA
Chief Investment Officer (CIO) and Partner
SageOne Investment Advisors LLP
Email:sv@SageOneInvestments.com
Website:www.SageOneInvestments.com

*SageOne Investment Advisors LLP is registered as an Investment Advisor with SEBI.
Appendix – Detailed Performance Evaluation
*We have consciously changed the composition of the core portfolio in terms of the average size of companies and the number of stocks in the portfolio after we started advising external clients in April 2012.
*The weighted average size of stocks at the start in FY10 was below $0.25 bn which has increased to near $1.3 bn by the end of May ’16. Also number of stocks have increased from 5 (+/- 2) in 2009 to 14 (+/- 2) during the past 4 years.
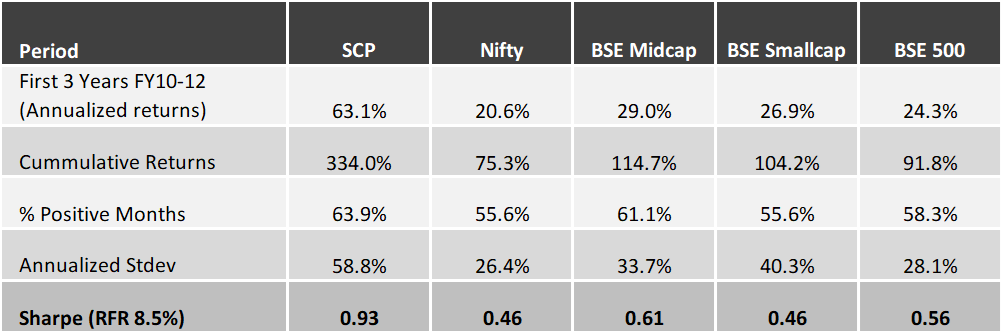
*Reasonable diversification was done by design to improve liquidity and reduce volatility as a result of which annualized standard deviation has come down from 59% for the first 3 years to 19% during the last 4 years.
Latest 4 Years Performance (April 2012 – Mar 2016)
First 3 Years Performance (April 2009 – March 2012)
Legal Information and Disclosures
This note expresses the views of the author as of the date indicated and such views are subject to changes without notice. SageOne has no duty or obligation to update the information contained herein. Further, SageOne makes no representation, and it should not be assumed, that past performance is an indication of future results.
This note is for educational purposes only and should not be used for any other purpose. The information contained herein does not constitute and should not be construed as an offering of advisory services or financial products. Certain information contained herein concerning economic/corporate trends and performance is based on or derived from independent third-party sources. SageOne believes that the sources from which such information has been obtained are reliable; however, it cannot guarantee the accuracy of such information or the assumptions on which such information is based.