
Dear Investors,
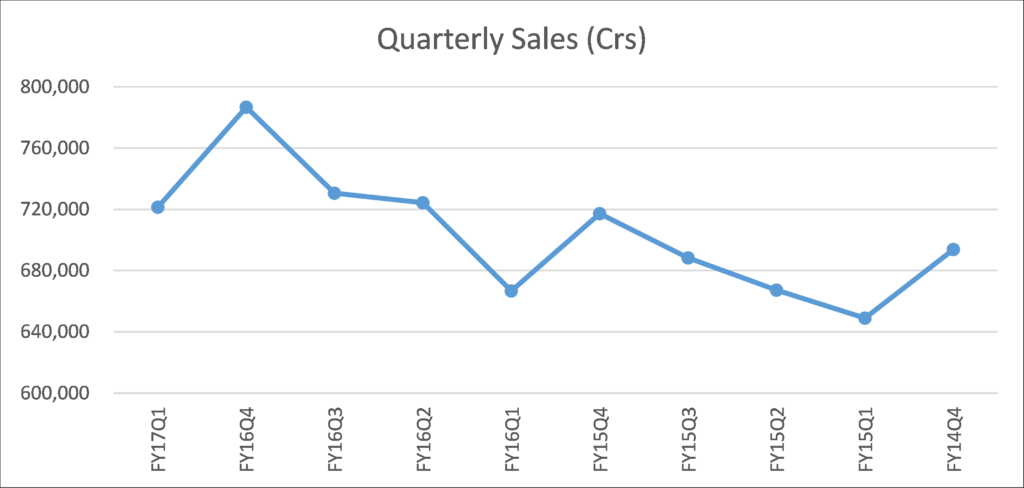
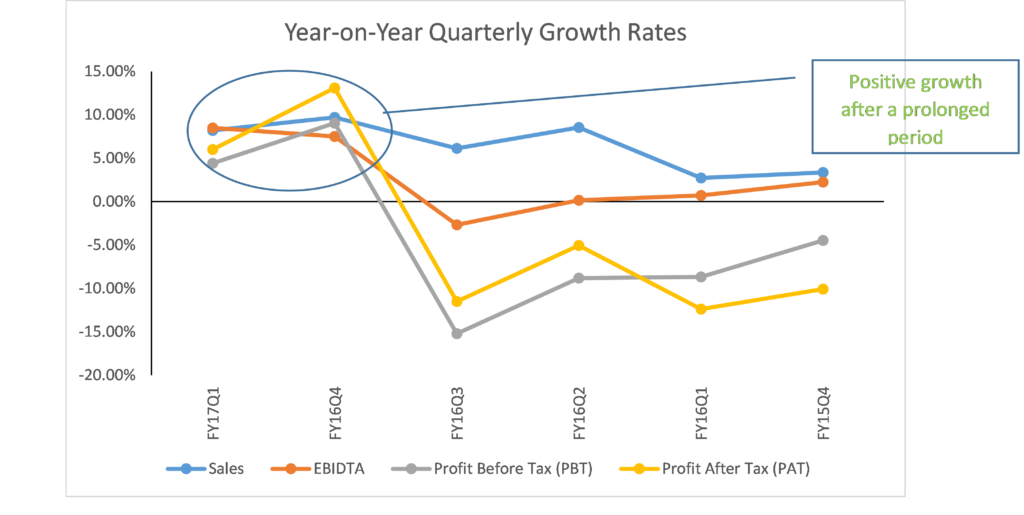
Since India’s union budget day (Feb 29, 2016), major indices such as Nifty 50 and BSE 500 have risen by more than 25% whereas the midcap index has risen upwards of 35%. Surely the risk appetite of investors towards equity in the current environment is very high given easy liquidity across the globe and consensus expectations of strong improvement in Indian fundamentals driven by factors such as good monsoon, clear path for GST (Goods and Services Tax bill) implementation and seventh pay commission. June ending quarter saw second consecutive quarter of sales and earnings growth after a long period of deterioration in earnings over multiple quarters. To track signs of a turnaround in growth, graphs and tables presented as appendix of this letter provide details on trend over the last 10 quarters.
The growth momentum we saw in Mar ‘16 quarter has slowed down in Jun ‘16 quarter and the growth is seen mainly because of the base effect of depressed earnings during corresponding quarter of last year. This is also evident from the fact that this quarter’s earnings are below earnings seen two years ago in the corresponding quarter. Dec ‘16 quarter will be a pivotal quarter to provide much stronger evidence of whether we are in a sustainable and higher growth trend or not. That quarter will see a confluence of key demand drivers such as harvest, payout of significantly increased salaries under seventh pay commission and the festive season.
Market levels are factoring in significant growth momentum over the coming quarters as we are trading at trailing PE multiples of close to 24x for the Nifty 50. At an absolute level, these are lofty levels seldom seen in the past. Statistically we are 2 Standard Deviations away from the mean (17-18x) and we have traded less than 5% of time in history above this multiple. A single multiple sometimes can be very misleading and can force an investor to take incorrect actions. In the next month, we plan to publish a comprehensive valuation study along with my evaluation of the current valuation levels by sector, hence I don’t want to present a half-baked view now.
Portfolio Performance*
Below is the gross (pre-fees and excluding dividends) performance of our core portfolio in INR terms for the last 7.5 years. For the first three years we managed proprietary funds and for the last 4.5 years we have been advising external clients. Since clients have joined at various stages, individual performance may differ slightly based on the timing of purchases. For uniformity and ease we measure our performance using a “representative” portfolio (that resembles advice given to clients) and we call it SageOne Core Portfolio (SCP). SageOne core portfolio is not a dummy portfolio but the CIO’s actual total equity portfolio.
7.5 Years Performance (April 2009 – Sept 2016)
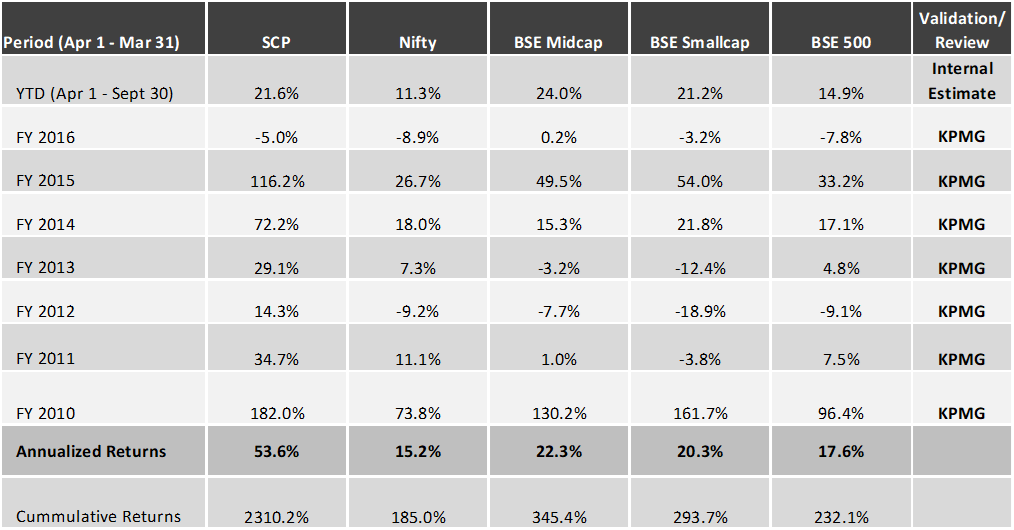
*Note: For detailed risk parameters and composition of the portfolio, please refer to the appendix at the end of this letter
In the past year and a half, even though we have been able to outperform the major indices, we have underperformed the small/midcap indices. This has been a period of indiscriminate buying especially in the small/midcap segment irrespective of the earnings coming through. As we have said in the past, we look for businesses that would grow their earnings at an annualized pace of at least 20% over a 2-3 year period. Our portfolio companies have historically compounded their earnings at well above 30% (weighted average). Even during the last 18 months, when earnings for the BSE 500 companies as well as our universe have contracted, our portfolio has been able to show growth well above our targeted levels of 20%. This earnings outperformance gives us reasonable confidence that even our portfolio stock prices would be able to do the same over the long term especially when their valuations (presented in our last newsletter) are reasonable. Below are the comparable growth numbers for our portfolio and our universe (defined in the appendix).
Quarterly (Y-o-Y Jun ‘16) Performance for Portfolio Companies (16 stocks) and our Universe

What’s our view on the investment environment?
Risks: Too much consensus and geopolitics
Since the lows in March 2009, Indian markets (Nifty 50) have gone up 3.5x in INR terms and 2.7x in USD terms. This compares to earnings rising by only 1.75x in INR terms over the 7 year period. Of course valuations were depressed in March 2009 trading nearly 30% below long term average and that exaggerates the difference. This is nothing unique to India but common across most major equity markets. The well-published reason behind this has been liquidity induced by central banks and almost consensus view that in a near zero interest rate and unfavorable demand environment for commodities, equities is the only game in town.
When such environment continues for years, investors get complacent and assume such goldilocks environment continuing forever. Such consensus view and easy policies last until they can no longer be sustained with sudden rise in inflation sharply increasing the yields and compressing the equity valuations. One such jolt has the power to wipe equity gains of many previous years.
The intensity of terrorist activities in Kashmir have increased in recent months and although highly unlikely, the risk of this turning into a full blown war with Pakistan has certainly escalated.
Opportunities: Structural themes emerging in India
Manufacturing has been a key area of focus for the government. Passage of GST will create an integrated market for the first time in India and will reduce many major inefficiencies and barriers within the internal market. Imagine current environment wherein time and cost to transport a container from a northern state such as Punjab to a port is much higher than shipping it from that port to markets such as Dubai or Brazil. Over the last three years, Indian government has taken several policy and regulatory measures to ease doing business and improve infrastructure in India. This is reflected in India’s rank improving from 71st to 39th over two years in the recently released World Economic Forum’s competitiveness ranking.
Over past decades, with high interest rates, high power cost, poor infrastructure and regulatory framework, Indian manufacturers have operated in extremely tough environment relative to other major manufacturing nations. This has forced them to work extremely efficiently to survive. With above improvements, we are excited about the manufacturing opportunity in India and believe that over the coming years India can sharply increase their market share in supplying goods to Indian and global customers similar to how we did in textiles and pharma.
Another major transformation is around the financial connectivity with initiatives such as Jan Dhan Yojana (100 mn plus bank accounts enabled on mobile devices) and direct benefit transfers which is an ability to transfer subsidies and other benefits directly to the bank accounts without leakages/corruption that has plagued this nation for decades. Leakages and corruption had created parallel economy (estimated to be as big as the official economy) within India with unaccounted cash that had no asset class to go into other than physical/unproductive assets such as gold and real estate. This will drastically change the asset classes in which people incrementally invest.
Interest rate and inflation cycle in India is moving in opposite direction to that in the developed markets. With inflation contained and trending downwards, India’s central bank has plenty of room to reduce the benchmark policy rate. This should help the demand and in turn earnings growth going forward cushioning downside risk in case of major global meltdown. While we are conscious of the above risks, we are excited about some structural themes emerging in India.
Other major change is the government’s plan for 100 smart cities and use of technology and digitization to enable growth in fields such as power, education and agriculture. Add to that the hyper pace at which internet is reaching rural India. We believe that this transformation will accelerate the pace of urbanization and discretionary consumption pattern of India’s population and offer huge growth for many companies offering the right products and services.
Portfolio Positioning: To benefit from emerging themes in India
While we are extremely vigilant about the risks that we have listed above and others that may emerge, we believe that India is at an inflection point and we are very excited about the opportunities we are able to find. We have positioned our portfolio with businesses that would be major beneficiaries of the above big themes. Playing it through direct and obvious ways is often expensive and key is to find indirect and cheaper routes of achieving the same growth in earnings that is not obvious to other investors currently.
Warm Regards,
Samit S. Vartak, CFA
Chief Investment Officer (CIO) and Partner
SageOne Investment Advisors LLP
Email:sv@SageOneInvestments.com
Website:www.SageOneInvestments.com

*SageOne Investment Advisors LLP is registered as an Investment Advisor and PMS with SEBI.
Appendix – Detailed Performance Evaluation
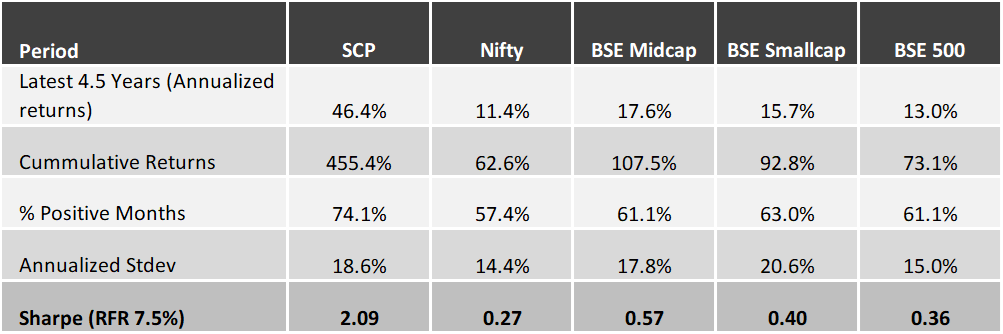
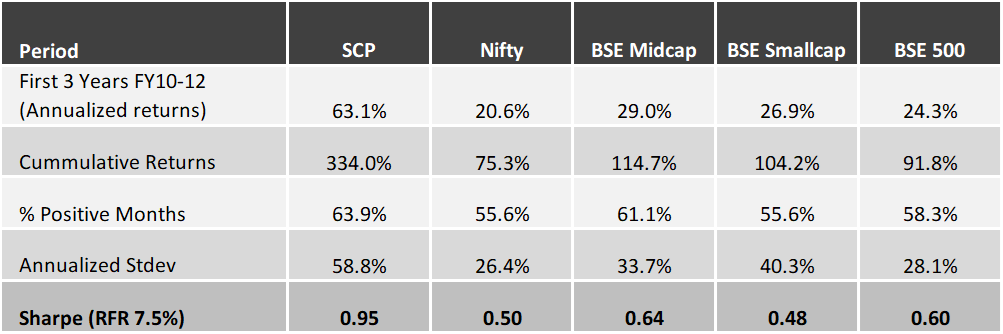
*We have consciously changed the composition of the core portfolio in terms of the average size of companies and the number of stocks in the portfolio after we started advising external clients in April 2012.
*The weighted average size of stocks at the start in FY10 was below $0.25 bn which has increased to near $1.3 bn by the end of Aug ’16. Also number of stocks have increased from 5 (+/- 2) in 2009 to 14 (+/- 2) during the past 4 years.
*Reasonable diversification was done by design to improve liquidity and reduce volatility as a result of which annualized standard deviation has come down from 59% for the first 3 years to 19% during the last 4.4 years.
Latest 4.5 Years Performance (April 2012 – Sept 2016)
First 3 Years Performance (April 2009 – March 2012)
Universe used for the following analysis: The starting universe for the Valuation analysis comprised all the companies (872) in the BSE 500, BSE Midcap and BSE Small Cap indices. After excluding companies who do not have 14 years of listed history, we were left with 557 companies. This universe covered about 80% of the total listed market capitalization. In the current analysis, we have further excluded the following sectors/companies: Financial sector, Crude Oil sector and specific companies Tata Steel, Vedanta and Suzlon due to large exceptional items that would skew the overall results.
Source of all data: Ace Equity
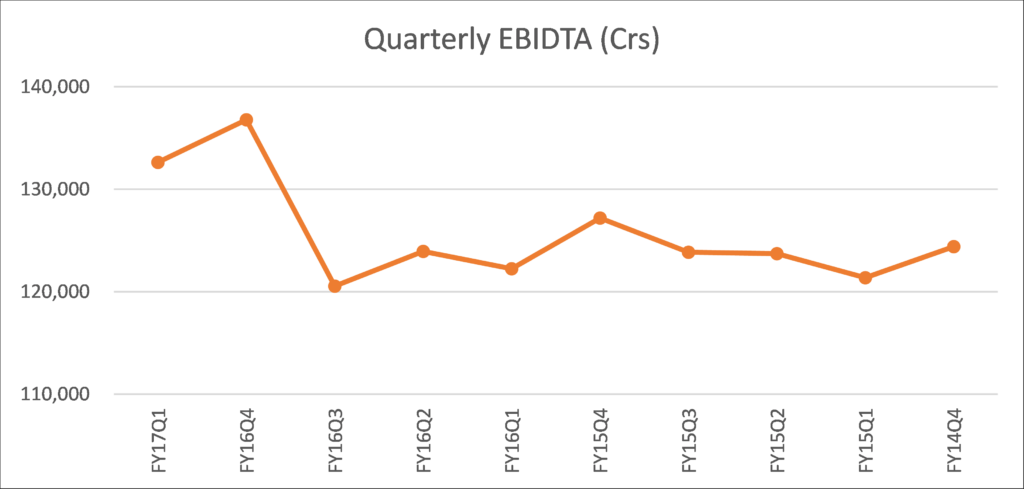
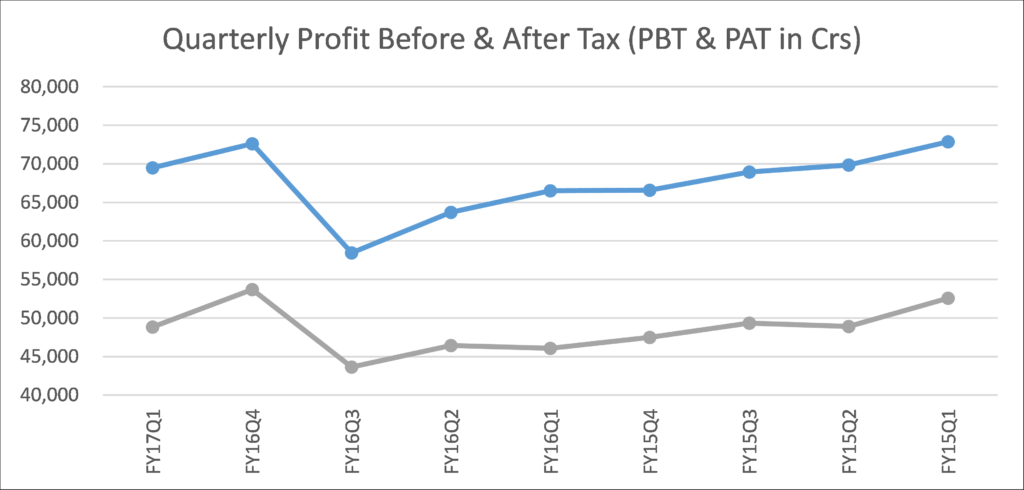
Market Quarterly trend over the past 10 quarters
(Last two quarters showing Y-o-Y growth in sales as well as earnings)
Consolidated P&L for the analyzed universe
(Shows trend of various line items across the 10 quarters)

Legal Information and Disclosures
This note expresses the views of the author as of the date indicated and such views are subject to changes without notice. SageOne has no duty or obligation to update the information contained herein. Further, SageOne makes no representation, and it should not be assumed, that past performance is an indication of future results.
This note is for educational purposes only and should not be used for any other purpose. The information contained herein does not constitute and should not be construed as an offering of advisory services or financial products. Certain information contained herein concerning economic/corporate trends and performance is based on or derived from independent third-party sources. SageOne believes that the sources from which such information has been obtained are reliable; however, it cannot guarantee the accuracy of such information or the assumptions on which such information is based.