
Dear Investors,
Indian equity markets continued its uptrend to new highs along with global markets. The smoothness of the rise has been astounding and the lack of fear (indicated by the low volatility index and hence historically cheapest cost of insuring your investments in the Nifty index) a bit worrying. In my previous memos, I have presented how the rally has been indiscriminate and how over the last four years one has been rewarded in proportion to the risk he/she has taken. The rise in stocks has had little relationship to the earnings growth and when such environment persists for too long, it ends up creating wrong investing learnings for many new investors. This environment reminds me of Howard Marks’ words in his October 1998 memo:
“Never confuse brains with a bull market.” When the 1990s began, the economy and the stock market were at very low levels. As a result, success came easily, risk-bearing paid off and the highest returns often went to those who took the most risk. They and their strategies were accepted as the best. In my opinion, (a) the three ingredients behind success are timing, aggressiveness and skill, and (b) if you have enough aggressiveness at the right time, you don’t need that much skill. But those who have attained their success primarily through well-timed aggressiveness can’t be depended on to repeat it — especially in tough times. When an investment track record is considered, it’s essential that the relative roles of these three factors be assessed”
In the last 4 years, if you had invested equally in the 800+ companies comprising the BSE Small and Midcap indices, your cumulative returns would have been 500% (i.e. 1 lac turning into 6 lacs). This is during a period when the sum of earnings for those companies have gone down (i.e. earnings growth was negative). Even if I exclude all the companies who have negative earnings, the average earnings growth (non-annualized) over this period was 125%, which is 1/4th of the market cap growth. I don’t think there is any fund manager who has beaten these returns, but most would claim to have handily beaten the indices which are weighted by float/Market Capitalization and hence skewed by the largest companies. Risk taking habit and luck plays a big role in returns in such environment and evaluating a fund performance becomes a tricky exercise. We don’t claim to have done extraordinarily well in this environment, but one thing that provides us satisfaction is that most of our returns have been because of earnings growth (36% annualized from FY12 to FY17) vs. the valuation rerating.
Note: Our performance is presented in the Appendices at the end of this memo
Though there are large pockets of extreme overvaluation in the markets, staying in cash and investing cautiously are two very different decisions. We are able to find structural opportunities available in the markets at reasonable valuations and hence we prefer to do the latter.
Increasing “Bubble” Talk
Across the world you are hearing increasing number of legendary investors warning about the froth in the markets and how we are close to a bubble. While there is no question that we are nowhere close to attractive valuations, one has to be careful in taking absolute valuation multiples at face value. For e.g. even though the absolute trailing PEx of US S&P 500 and BSE 500 indices are similar and close to 25x, both the markets are at extreme ends of profitability. US corporate profitability is at historical highs at 8.6% (per Yardeni research) whereas India’s corporate profitability is around 5% and close to historical lows (range 4.5 – 10%). Hence the denominator “E” in the P/E ratio has to be accordingly looked at with that context.
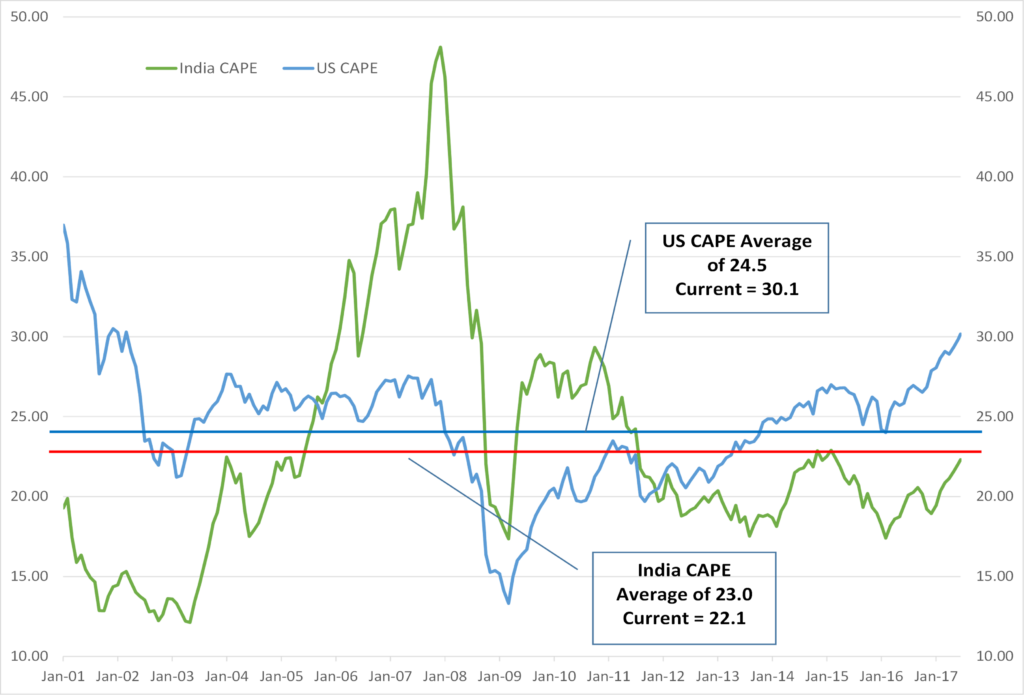
One of the ways is to look at Cyclically Adjusted PE (CAPE) ratio which is developed by professor Robert Shiller and is defined as price divided by the average of ten years of earnings (moving average), adjusted for inflation. This ratio addresses the issue of margin volatility during an economic cycle. Since 2001, US CAPE averaged 24.5 and currently it stands at 30.1 which is 1.5 standard deviations above average. India’s Sensex CAPE during the same period is at 23.0 and currently it stands at 22.1 which is slightly below average. Please note that Sensex CAPE had reached a high of 48.1x in December 2007 and currently we are less than half of that level.
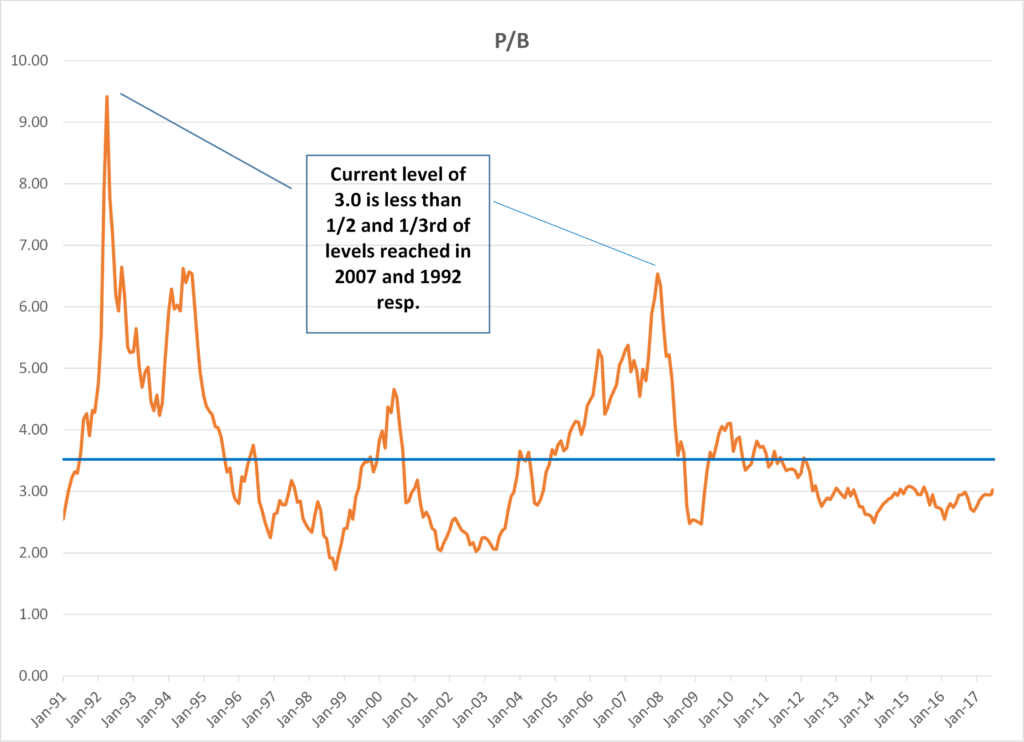
Sensex PBx is currently at 3.02 which is below the average of 3.5 since 1991 and half of the level (6.5) reached in December 2007 and 1/3rd of the levels (9.4) reached in April 199
Other widely followed valuation indicators also point to below average levels. Market Capitalization to GDP ratio for India currently is just above 80% and well below the peak levels of 149% reached in December 2007. In comparison, US is currently at 140% which is well above the 110% levels reached in 2007 and close to the peak levels of 150% reached in 2000.
There is Reasonable Caution Around
During the past 3 months, I have traveled extensively across the country meeting companies as well as investors. Surprisingly most of the experienced investors I met are worried about the market valuations and many have maintained significant liquidity in anticipation of a market correction. This investor sentiment isn’t indicating bubble kind of behavior where everyone is excited. We have never been good at timing the markets and I haven’t come across anyone who is able to do it consistently and successfully, tough I have come across many who indulge in it with full confidence in every cycle. In the meantime Nifty is on its longest streak (in days) of rally without a 5% plus correction. Once again markets have shown that attempts at market timing are a source of risk and not protection.
The fund management industry worldwide is structured to follow herd mentality and that ends up taking markets to extremes during upsides and also during downsides. Funds flow is directly proportionate to the returns in the asset class and can also be seen currently in India. Even if a fund manager believes that the markets are overvalued and it doesn’t make sense to deploy the flood of liquidity he is getting every day at these valuations, can he risk staying too much in cash? Many of the cautious fund managers will run out of staying power, losing their jobs or clients after having missed the gains and underperforming the peers. In the end they well might turn out to be right, but no one knows how far that end is and hence the industry is designed to keep dancing until the music stops.
How Easy/Difficult is it To Time the Markets?
Stock market followers know that markets do not rise or fall steadily. For short periods of time the markets may skyrocket or plunge and these short periods are extremely crucial for the long-term investment returns. We have tried to analyze Sensex’s history from 1979 to 2017 with this context and following are the key observations:
- During the 38 years history, Sensex went up by 251x (15.5% annualized)
- If you missed 7% of the best months, your returns would have been ZERO
- If you missed 1% of the best days, your returns would have been ZERO
Corollary to this is also critical to note:
- If you missed just 10 (2%) worst months, your returns would have been 1600x
- If you missed just 5 (1%) worst months, your returns would have been 760x
- If you missed 1% of the worst days, your returns would have been 56,800x (33.4% annualized)
These startling statistics are true of most periods and across markets. Someone having the ability to time the best and worst months can enable one to become the best fund manager very quickly without understanding any businesses. Un/Fortunately that hasn’t happened so far. The following statistics and graphs show how difficult it is to predict the big moves based on multiples.
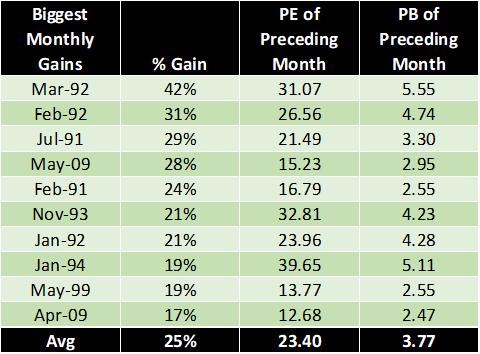
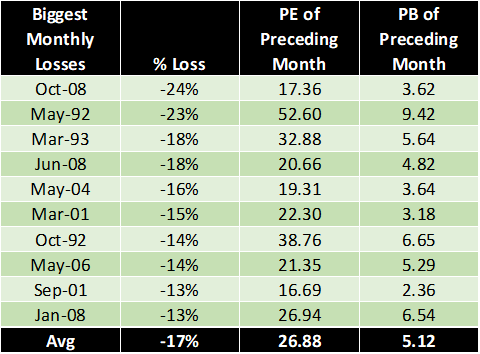
In the last 38 years for Sensex, 6 out of 10 biggest monthly gains have occurred when the PEx was above 20x and PBx of above 3x. If you compare the average preceding PEx of Sensex during the top 10 biggest monthly gains vs. top 10 biggest monthly falls, its 23.4x during gains and 26.9x during falls. The difference isn’t statistically significant to develop a strong relationship between PEx multiples and biggest crashes or jumps. Even though the difference (35%) between average PBx during top 10 gains and falls is much higher compared to the difference in PEx (15%), it still fails to provide a statistically significant correlation. Graphical view is presented below. I have plotted the PE and PB multiples across two separate decades 1991-2000 and 2001-2010. The “Green” bars represent the biggest gains and the “Red” bars represent the biggest falls in Sensex.
Plot of PEx (blue line) & PBx (red line) with Bars of Biggest Gains/Falls in Sensex
1991 – 2000

2001 – 2010

Big gains and falls occur in bunches, but designing a system to predict them is a herculean task.
Relationship between Valuation and Returns?
→ I tried to plot 1 year, 3 year and 5 year returns vs historical PB & PE multiples and the data trend lines (linear as well as polynomial) have a very weak R-Squared (statistical measure that represents the percentage of movement in one variable that can be explained by movement in another).
→ While 85-100% is considered high, the highest R-Squared I observed was for the 5 year returns at 25% which is very weak. Ideally one would have liked to see strong inverse relationship between PBx and returns i.e. lower the PBx higher the future returns and vice versa. If investment was that easy, computers would have ruled this profession and such opportunities would have vanished quickly in any case.
→ I even tried to back test performance by moving in cash when PE/PBx goes above various levels (e.g. PBx above 4x, 5x, 6x, etc. or PEx above 25x, 30x, etc.), but none provided significant outperformance to justify increased churn and costs.
I am sure there are investors who probably have much superior skills or sophisticated algorithm to time the market. Unfortunately we do not have either and hence we do not engage in it. We continue to be as invested as possible and only be in cash (partial) if we are not able to find reasonably attractive bottoms up opportunities that meet our return criterion. If we stick to our discipline of valuation and business quality, and if markets march towards extremes, we might encounter periods when we have very few attractive opportunities to invest in and we remain in higher cash. We don’t believe today is such a period.
Even though I have showcased that Sensex valuations are away from the extreme levels, the same may not be true for hundreds of small and mid-cap companies. We continue to be very cautious of companies who have moved up without earnings support based only on hope and liquidity inflow. Again to repeat myself, this is the time to be extra careful in the price one pays for any company. Sharp corrections are inevitable and it’s just a matter of time when the next one occurs. One thing that would save us from the accompanying extreme pain and big capital loss is our discipline in valuation and business analysis.
Warm Regards,
Samit S. Vartak, CFA
Chief Investment Officer (CIO) and Partner
SageOne Investment Advisors LLP
Email:sv@SageOneInvestments.com
Website:www.SageOneInvestments.com

*SageOne Investment Advisors LLP is registered as an Investment Advisor, PMS and AIF with SEBI.
Appendices
PMS Portfolio* Performance (Net of Fees)

* PMS portfolio is composed of 22 equal weighted stocks. Details of SCP are given below.
Investment Advisory Core Portfolio Performance (Gross Before Fees)
Below is the gross (pre-fees but excluding dividends) performance of our core portfolio in INR terms for the last 8 years and 4 months. For the first three years we managed proprietary funds and for the last 5 years and 4 months we have been advising external clients. Since clients have joined at various stages, individual performance may differ slightly based on the timing of purchases. For uniformity and ease we measure our performance using a “representative” portfolio (that resembles advice given to clients) and we call it SageOne Core Portfolio (SCP). SageOne core portfolio is not a dummy portfolio but the CIO’s actual total equity portfolio.
8 Years 4 Month Gross Performance in INR (April 2009 – July 2017)
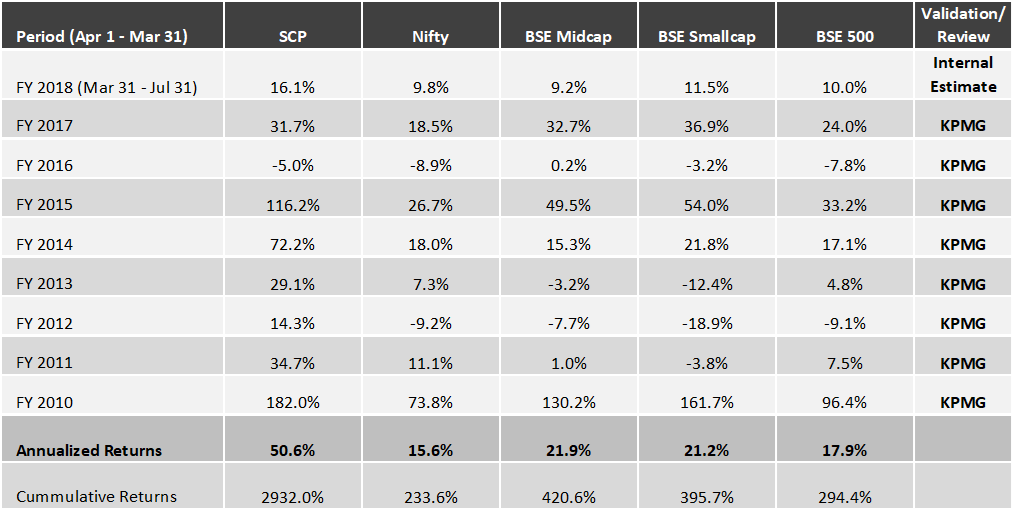
*SCP consists of 14 stocks as of Jul 31, 2017. Investment Advisory clients are advised this portfolio.
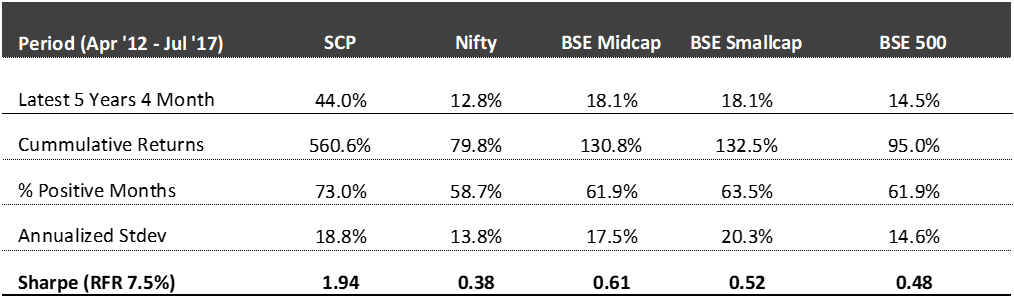
Core Portfolio: Latest 5 Years 4 Month Performance (April 2012 – June 2017)
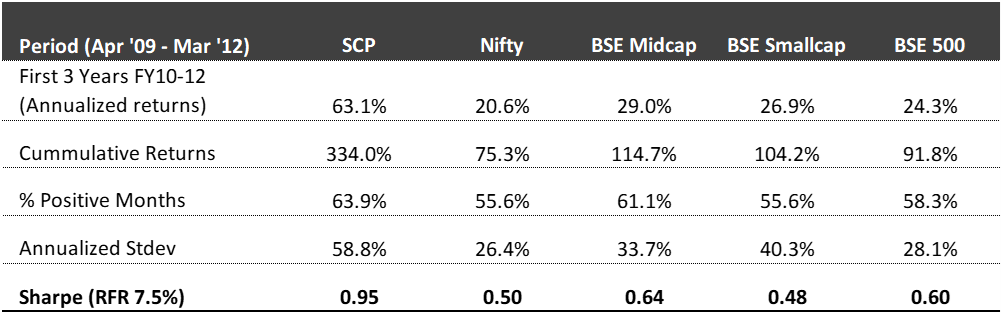
First 3 Years Performance (April 2009 – March 2012)
*We have consciously changed the composition of the core portfolio in terms of the average size of companies and the number of stocks in the portfolio after we started advising external clients in April 2012.
*The weighted average size of stocks at the start in FY10 was below $0.25 bn which has increased to near $1.0 bn by the end of Jul ’17. Also, the number of stocks has increased from 5 (+/- 2) in 2009 to 14 (+/- 2) during the past 5 years.
*Reasonable diversification was done by design to improve liquidity and reduce volatility as a result of which annualized standard deviation has come down from 59% for the first 3 years to 19% during the last 5 years.
Legal Information and Disclosures
This note expresses the views of the author as of the date indicated and such views are subject to changes without notice. SageOne has no duty or obligation to update the information contained herein. Further, SageOne makes no representation, and it should not be assumed, that past performance is an indication of future results.
This note is for educational purposes only and should not be used for any other purpose. The information contained herein does not constitute and should not be construed as an offering of advisory services or financial products. Certain information contained herein concerning economic/corporate trends and performance is based on or derived from independent third-party sources. SageOne believes that the sources from which such information has been obtained are reliable; however, it cannot guarantee the accuracy of such information or the assumptions on which such information is based.