
Dear Investors,
Indian equity markets had a good FY2017 and the micro, small and mid-cap stocks continued their outperformance that started in September 2013. The rally was so broad based that one’s portfolio had to be a statistical outlier to have lost money. The markets rallied capturing many hurdles such as muted earnings growth, demonetization, US presidential elections and Brexit with the support of strong fund flows and optimistic view of India’s future under the Modi government. Stocks are from no perspective cheap and a common question that we hear from new and old investors alike is, “Does it make sense to invest now at such elevated levels?” Before I provide my perspective on this investor dilemma and talk about how we are investing in such environment, let me cover couple of updates.
We have recently launched a PMS offering and have also received in principle approval for an AIF offering which will also be launched soon. AIF will be the same portfolio as our current core portfolio under Investment Advisory (IA). We generally have maintained a portfolio of 14 (+/- 2) stocks in this with a range of 12-20 positions. PMS is the same strategy except that the portfolio is more diversified with a range of 20-30 stocks and the minimum market cap of a stock would be INR 300 crs vs INR 1500 crs in AIF/IA portfolio. The performance of both these offerings is presented as appendix at the end of this memo.
More Perspective on Current Valuation
In my previous memo (January 2017 Memo ) I have written extensively on valuation and how PEx expansion has been inversely proportional to the size (market capitalization) of the companies even when earnings have worsened for them over the last three and a half years. Let me present one more way of looking at whether valuation levels are elevated in the current markets. Long term (2002-2016) average PEx for the universe of about 553 companies we cover in our valuation analysis has been around 16x. Multiples for indices such as Nifty are weighted by float and hence are skewed by largest of companies and doesn’t provide the breadth of valuation expansion. To get a sense of that, let’s look at the % of companies trading above the long term average PEx of 16 over the last 17 years. Below is the graph.
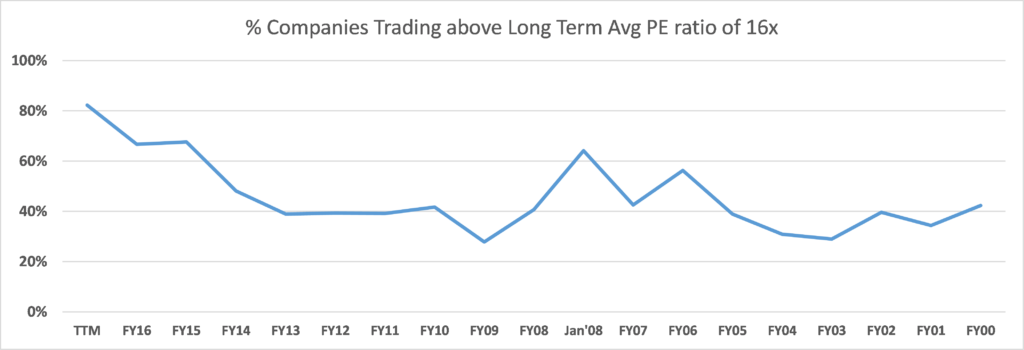
You can see that on an average less than half of the companies trade above the 16x multiple. FY03 and FY09 saw the lowest levels around 28-29% and both of those were the best times for an investor to have invested. Currently 82% of the companies are trading above 16x multiple and that’s higher than what we saw even in Jan’08 peak or anytime during this century. So there is no question that we are in an unprecedented territory and if earnings don’t pan out the way investors are hoping for, we could head for some unpleasant volatility.
Current Environment is Extremely Tricky
Typically markets are euphoric near the peaks of economic cycle where sales growth is strong, margins are way above average and corporate capital expenditure environment is buoyant. This time around markets are euphoric when economic cycle is near the trough with margins below average, sales growth and capital expenditure virtually non-existent. During such environment the valuation ratios may seem deceptively high due to the denominator (earnings) in the valuation ratios being suppressed. Margins can quickly expand and earnings can violently jump at any reasonable pickup in volume, capacity utilization and capital expenditure cycle. If one stays out of the markets fearing high multiples, he/she may completely miss out on the big portion of the market rally. At the same time, if earnings don’t pick up or if a major risk event occurs in the world, markets can correct sharply.
In every bull phase investors try and justify high multiples using different logics. Currently the most prevalently accepted logic is that Indians are extremely underinvested in equities and asset allocation shift from real estate, gold and fixed deposits will have long lasting funds flow into equities thereby maintaining high multiples. There is no denying the structural change, but when you look at history in US and other developed markets who have gone through similar shift the valuation multiples did see short term jump, but have mostly reverted to long term averages. There was a thesis carried out in Florida State University in 2015 to study relationship of market participation and valuation. Correlations were statistically inconclusive. Bottom-line is that the long term returns from equities will highly correlate with long term earnings growth and that will remain the hard reality irrespective of market sentiments.
During euphoric times stock rallies are broad based, it’s easy to make money and in many cases you make more money if you throw caution out of the window. Everyone runs short of ideas and investors pounce on any sign of new emerging theme. IPOs seem more exciting than similar listed businesses. Whoever jumps on the idea first makes the most amount of money and ones who spend time in analyzing/understanding the business pay the penalty by buying at significantly higher levels. When you experience the missing out feeling few times, even many experienced investors start investing first and analyzing later. We are in such environment and it reminds me of Warren Buffet’s famous words, “Only when the tide goes out do you discover who’s been swimming naked”. When you use short cuts and run behind quick money by relaxing your discipline, you do not realize that you are one of the ones swimming naked because the froth around you hides everything. Rising tide lifts all boats and riding high waves is intoxicating. For an investor it is extremely important to understand high Beta vs high Alpha.
Understanding high Beta vs high Alpha
It is easy to mistake Beta with superior performance. Beta is high risk high return strategy and may outperform during bull phase but significantly underperform during challenging phase. For example during the last 3.5 years if one had randomly invested in a well-diversified small cap portfolio (from a universe of bottom 1000 of the top 1500 companies by market cap), he/she would have outperformed Nifty 50 by at least 4x, but this outperformance shouldn’t be mistaken with superior performance. Alpha is superior performance against the right universe and especially considering the risk employed in the strategy. Following example is a try at representing the high Beta vs high Alpha strategy.
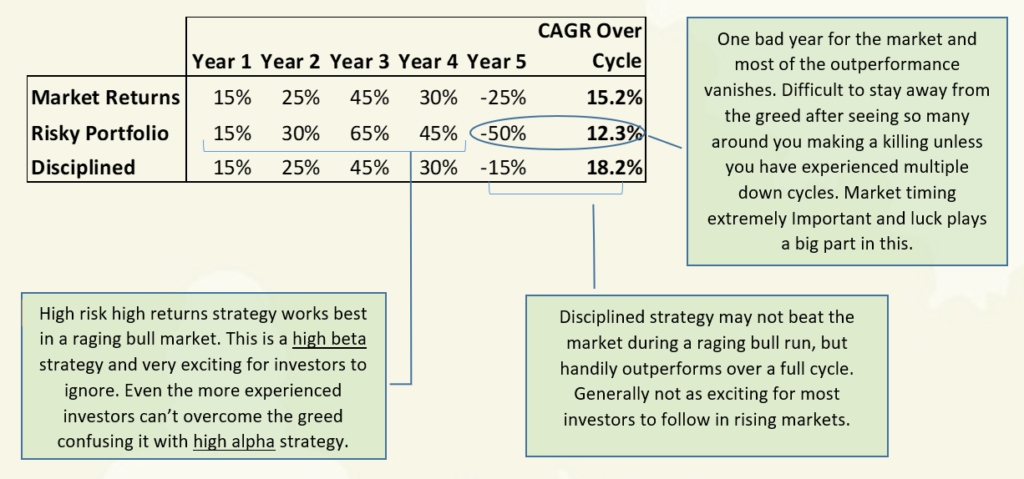
Easy money attracts more and more inexperienced investors into the market. The numbers getting pulled in the 3rd year is vastly higher than in the 2nd year, similarly the number in the 4th year is vastly higher than the 3rd year. Sadly the maximum come in the 5th year and lose major money to not ever return to the stock market.
So, is it a Good Time to Invest Now?
This is a common question asked by many new as well as experienced investors. You could fall flat on your face advising either ways as short term is highly unpredictable. Markets can swiftly move against your advice and I believe trying to predict short term market movements is a useless exercise for fundamental investors. My experience has not been that great at market timing. If you are comfortable with your portfolio businesses and their absolute (not relative) valuations, there is no reason to exit or not add to such positions irrespective of what market valuations are. These are times to be extremely cautious and absolutely not compromise on your business evaluation process. Being cautious doesn’t always mean you have to be defensive. You just have to be extra careful in evaluating prices to pay for businesses as it is easy to get brainwashed by the relative (of already expensive peers) valuation rationale employed by analysts/co-investors and to forget about intrinsic value.
When your goal is to create significant alpha over the market, you have to think independently and differently. Investment rationale based on widely and commonly known themes such as GST, affordable housing and unorganized to organized movement will unlikely end up creating alpha. Indian markets have become extremely efficient and information arbitrage is no longer a winning strategy. I believe that the only way one can sustainably outperform (be careful in differentiating beta vs alpha outperformance) the market is by one’s ability to connect the dots, and conducting thorough and superior analysis of businesses and understanding their fair value.
We continuously strive to do the above and try and stay ahead of the markets. As markets and some of our stocks have become uncomfortably expensive, we have exited such investments and have been able to find good replacements which aren’t followed by the herd. This has helped us lower the valuation of our portfolio while not having to dilute the quality. Generally we are almost fully invested but have slightly below 15% cash levels currently. This is kept mainly to accommodate few interesting ideas we are working on but have not yet completed our analysis on. Following are the parameters of our core portfolio:
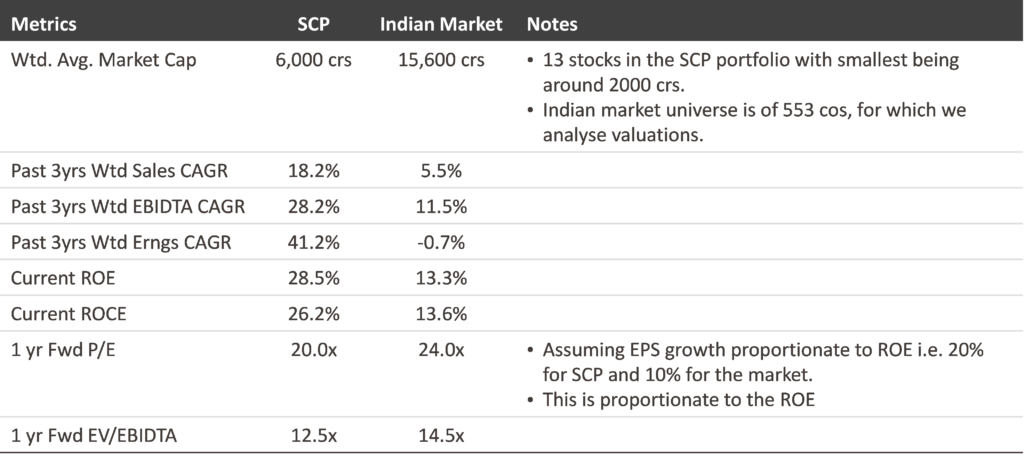
We believe that a portfolio with more than double the profitability of the market and available at a PEx below ROE/ROCE, long term expected earnings growth rate as well as market PEx is reasonably attractive even at absolute levels. For PMS offering, we are in the midst of building the portfolio for all the new clients and have 19 stocks with almost the same parameters as above at the portfolio level. Cash level is slightly higher here but as we add stocks to the portfolio, we expect to reduce the cash levels considerably over the coming months.
As finding attractive valuations become increasingly difficult, we continue our quest for outstanding investments with more vigor than ever before.
Warm Regards,
Samit S. Vartak, CFA
Chief Investment Officer (CIO) and Partner
SageOne Investment Advisors LLP
Email:sv@SageOneInvestments.com
Website:www.SageOneInvestments.com

*SageOne Investment Advisors LLP is registered as an Investment Advisor, PMS and AIF with SEBI.
Appendices
PMS Portfolio Performance (Net of Fees)

Investment Advisory Core Portfolio Performance (Gross Before Fees)
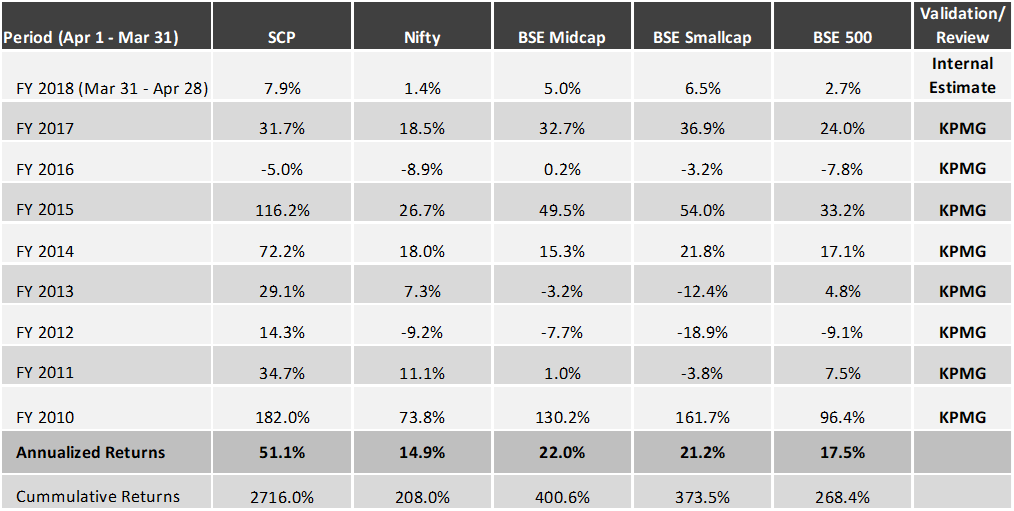
Below is the gross (pre-fees but excluding dividends) performance of our core portfolio in INR terms for the last 8 years and 1 month. For the first three years we managed proprietary funds and for the last 5 years and 1 month we have been advising external clients. Since clients have joined at various stages, individual performance may differ slightly based on the timing of purchases. For uniformity and ease we measure our performance using a “representative” portfolio (that resembles advice given to clients) and we call it SageOne Core Portfolio (SCP). SageOne core portfolio is not a dummy portfolio but the CIO’s actual total equity portfolio.
8 Years 1 Month Gross Performance in INR (April 2009 – April 2017)
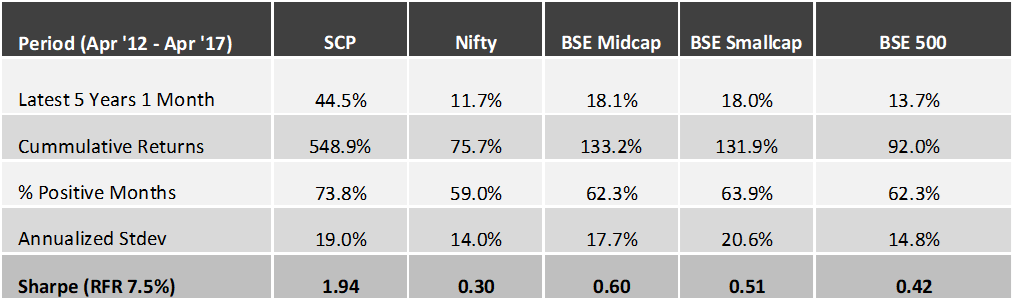
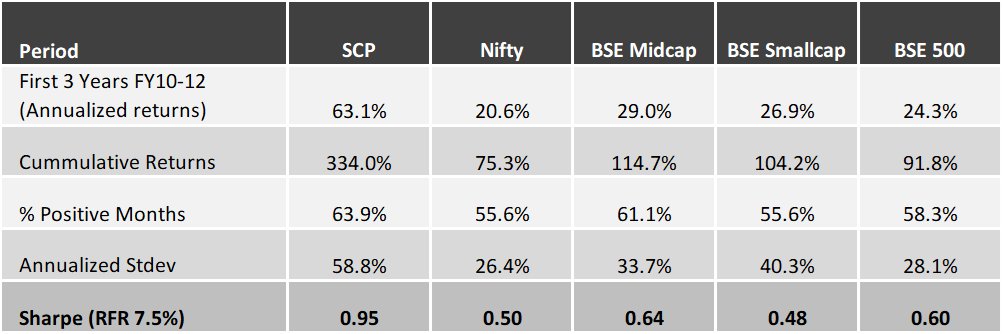
*We have consciously changed the composition of the core portfolio in terms of the average size of companies and the number of stocks in the portfolio after we started advising external clients in April 2012.
*The weighted average size of stocks at the start in FY10 was below $0.25 bn which has increased to near $1.0 bn by the end of Mar ’17. Also, the number of stocks has increased from 5 (+/- 2) in 2009 to 14 (+/- 2) during the past 4 years.
*Reasonable diversification was done by design to improve liquidity and reduce volatility as a result of which annualized standard deviation has come down from 59% for the first 3 years to 20% during the last 5 years.
Core Portfolio: Latest 5 Years 1 Month Performance (April 2012 – April 2017)
First 3 Years Performance (April 2009 – March 2012)
Universe used for the following analysis: The starting universe for the Valuation analysis comprised all the companies (872) in the BSE 500, BSE Midcap and BSE Small Cap indices. After excluding companies who do not have 14 years of listed history, we were left with 557 companies. This universe covered about 80% of the total listed market capitalization. In the current analysis, we have further excluded the following sectors/companies: Financial sector, Crude Oil sector and specific companies Tata Steel, Vedanta and Suzlon due to large exceptional items that would skew the overall results.
Source of all data: Ace Equity
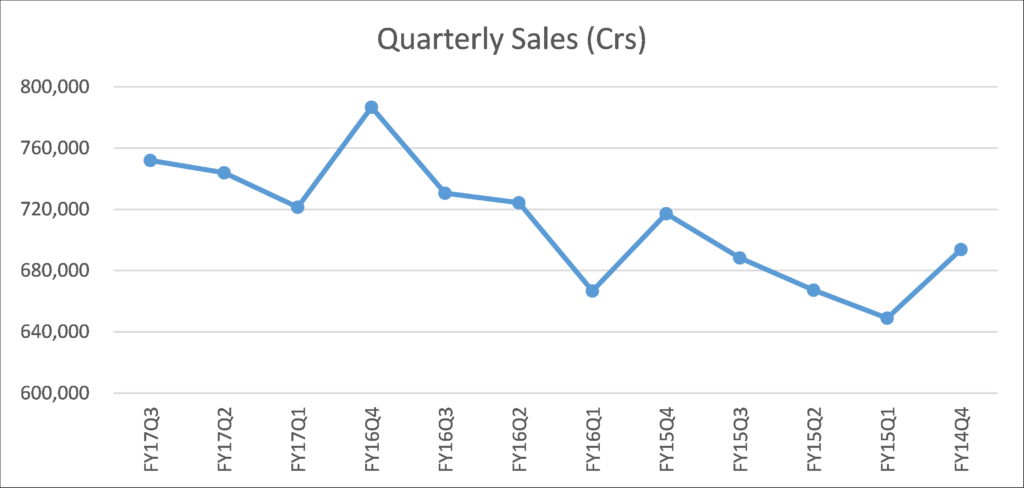
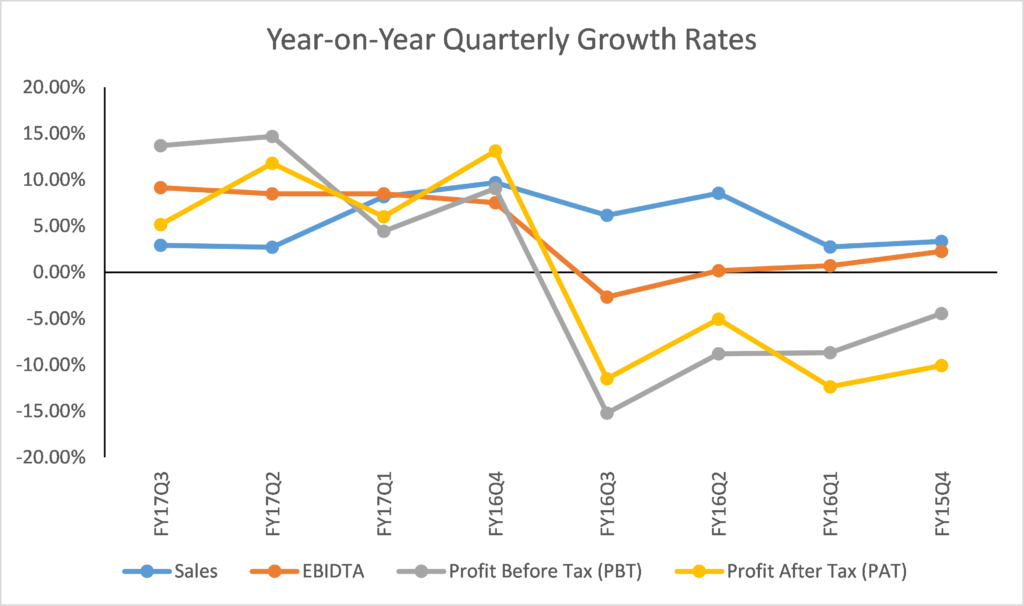
Market Quarterly trend over the past 12 quarters
(Latest four quarters showing Y-o-Y growth in sales as well as earnings)

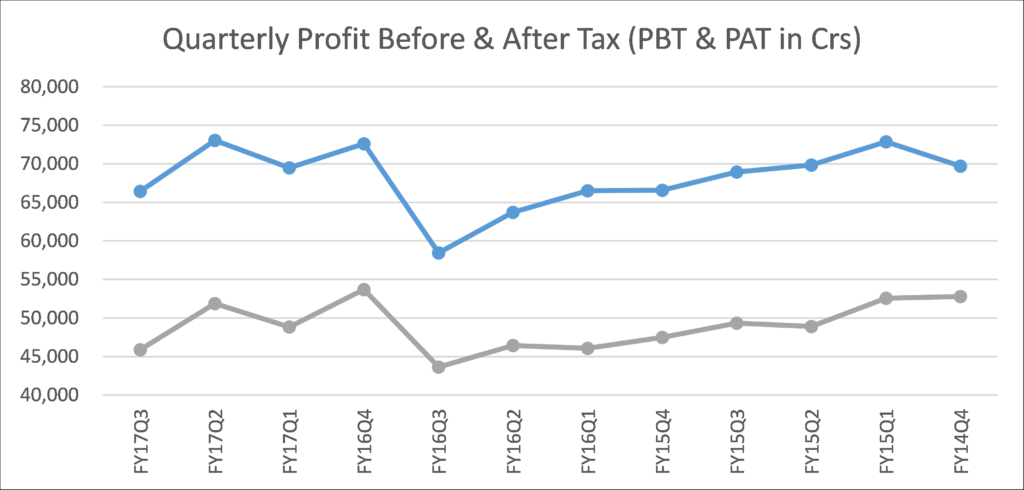
Consolidated P&L for the analyzed universe
(Shows trend of various line items across the 12 quarters)

Legal Information and Disclosures
This note expresses the views of the author as of the date indicated and such views are subject to changes without notice. SageOne has no duty or obligation to update the information contained herein. Further, SageOne makes no representation, and it should not be assumed, that past performance is an indication of future results.
This note is for educational purposes only and should not be used for any other purpose. The information contained herein does not constitute and should not be construed as an offering of advisory services or financial products. Certain information contained herein concerning economic/corporate trends and performance is based on or derived from independent third-party sources. SageOne believes that the sources from which such information has been obtained are reliable; however, it cannot guarantee the accuracy of such information or the assumptions on which such information is based.