
Dear Investors,
It is astonishing to see the divergent nature of the markets in the last two years. 2017 was characterized by historically low volatility, euphoric rise in many segments of the markets and fearless investors. 2018 was almost the exact opposite characterized by high volatility, big crashes in many segments of the markets and fearful investors.
2018 was a difficult year for most investors as well as at SageOne. Last year in the memo, I had written “While the absolute returns of SCP for 2017 may seem high (56%), they are not so extraordinary when one looks at the performance of the broader universe” as well as when one compares with the accompanying earnings growth (~25%). As performance ran ahead of earnings growth in 2017, the exact reverse happened in 2018.
In 2018, fundamentally our portfolio companies delivered an earnings growth (YoY trailing 12 months reported earnings) of ~30%, but delivered -15% returns in INR terms. In both the years, we were satisfied by the fundamental performance of our portfolio companies and believe that in the long term the returns would converge to the earnings growth. In the short term we have very little control over the returns and can’t avoid divergences between the earnings growth and stock performance.
In my January 2018 memo, I had presented the divergence of small/mid-cap universe (vs large caps and historical averages) in terms of their historic valuation levels and especially how their returns had completely decoupled from the low earnings growth. It took barely 6 months to revert those levels to mean. It’s astonishing how mean reversion finds reasons which seem so obvious in hindsight but extremely complicated looking ahead. It’s even more amazing how exact opposite divergence is now getting created in large caps vs the mid/small-cap universe. There is no bigger confidence booster than the price action and that’s what large caps and especially consumer oriented consistent stocks have provided in 2018. Lessons learnt as recent as 2017 are easily overthrown by confidence generated by performance.
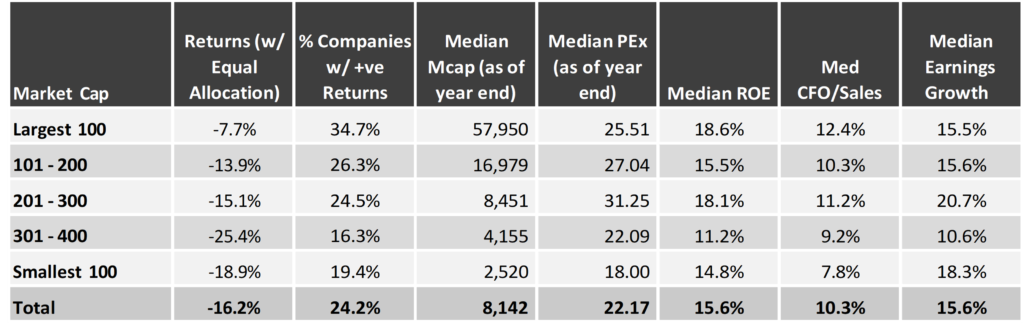
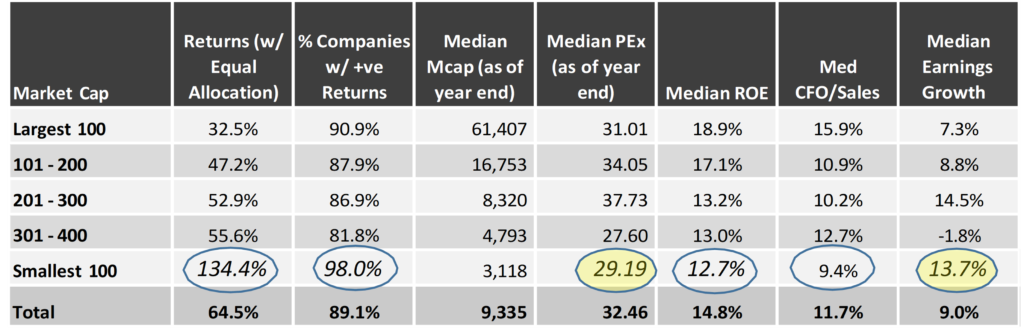
Let me present analysis for BSE 500 companies for 2018 and also compare it with the table presented last year for 2017. Clearly 2018 delivered better earnings growth across size, but less than 25% companies delivered positive returns compared to nearly 90% in 2017. There has been significant correction in multiples as you go beyond the top 300 companies and more so beyond top 500 (not part of these tables).
*Note: Our detailed portfolio performance is presented in the Appendices at the end
Breakdown of BSE 500 Companies Performance in 2018
Breakdown of BSE 500 Companies Performance in 2017
Source: Ace Equity
Mean Reversion – Friend and Foe
Most businesses are cyclical as are returns from most investment styles. Mistakes are made when investors extrapolate the trends/profitability at troughs or peaks of the cycles by assuming that they are sustainable. Lengths of cycles may vary, but the values typically do oscillate around the mean. Investors who understand these cycles and can predict (extremely rare) the reversals, can be very successful at investing. Unfortunately Greed and Fear phenomenon is so strong at the reversals, that most do the exact opposite and end up underperforming the averages. That’s what happened at the end of 2017, when maximum inflow came into the best “performed” segment (mid-small cap) of the markets. The same is happening in large caps as is indicated by their current valuation premium vs the small cap companies.
Investment style that has worked exceptionally and consistently well in the recent few years has been the one investing in high quality, consumer oriented and consistent growth companies. As an investor, one has to continuously challenge his/her investment style and keep evolving to make sure that the learning and improvement never stops. Historically we have invested in the above kind of companies until a point when they were expensive (as we believed), but some of the businesses kept expanding their valuation multiples to levels never envisioned before. Price action is such a powerful psychological factor that it can destroy or build confidence in businesses irrespective of their fundamental performance. Generally looking objectively at historical data helps reaching a “roughly right” decision rather than going by sentiments and reaching an “exactly wrong” decision.
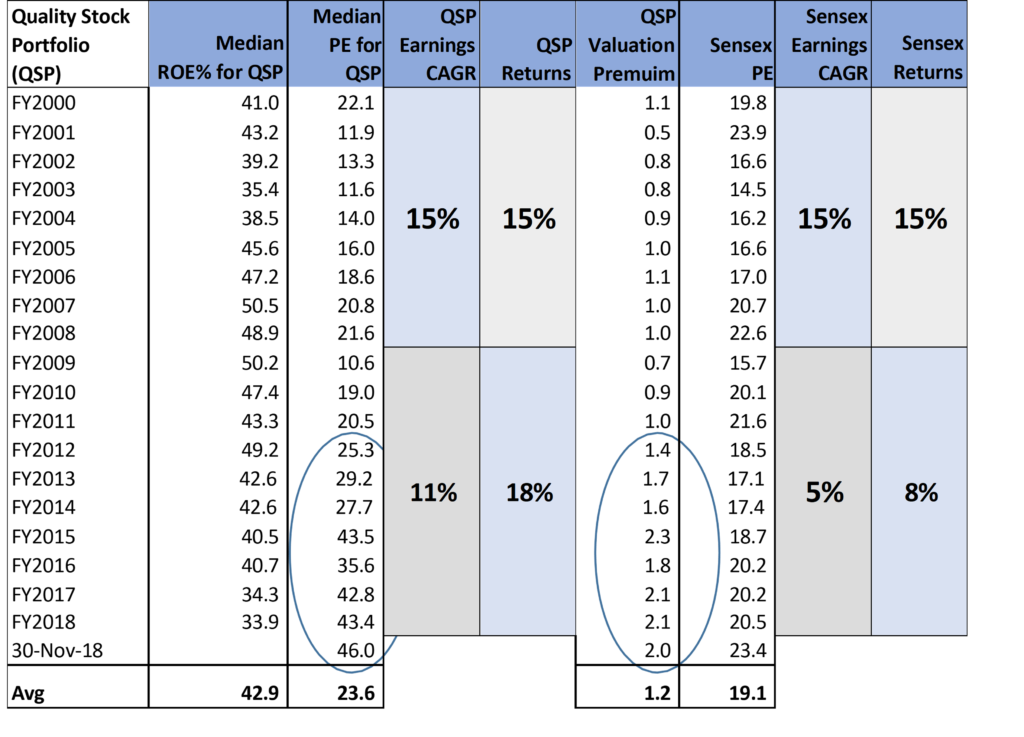
To analyze how such companies have been valued and performed historically, we created a 20 stock portfolio at the start of each year by selecting companies having the best ROE (previous 3 years average). This filter has picked the many of the consumer oriented stocks that we call quality today. Following is a table comparing this Quality Stocks Portfolio (QSP) with Sensex.
Quality Stocks Portfolio (QSP) vs Sensex-
Source: Ace Equity
The above analysis indicates that the quality stocks had earnings growth and traded at levels similar to the Sensex until 2011. After 2011, as earnings growth fell below inflation for the overall market, the quality stocks continued growing at double digits thereby showcasing resilience. The superior growth and resilience attracted attention of investors and these stocks started re-rating. Today they trade at double the valuation of Sensex. Following are some of the reasons, why investors have herded towards these proven quality stocks:
→ Avoiding “landmines” key to avoiding pain. There have been many in the recent past and very few have the stomach to digest the fall or even fear of having to in the future. Better to be safe in these quality stocks.
→ Many decision makers may lose their job by looking foolish after committing mistakes. On the other hand, most probably will not lose the job because they underperformed by investing in popular stocks.
→ Many managers value “not going wrong” much highly vs. missing out on extra returns
→ For FIIs, emerging markets itself are riskier asset class. Why increase further risk by getting into emerging companies
→ Consistency pays off by being much resilient during rough markets
Longer one stretches his holding period, lesser impact high valuation has on returns. Question is whether such valuations are sustainable or do they also risk reversion to mean. If they do, then the current multiple could half and assuming that the earnings growth continues the recent run rate, investors risk losing out on returns for the next 7-8 years.
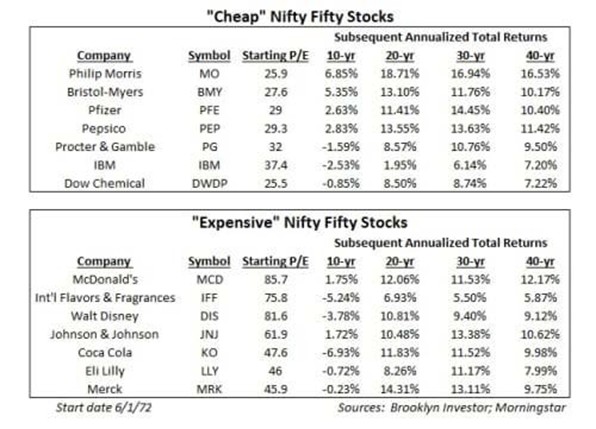
Often it helps looking at other markets to learn from their history. In the United States, the term Nifty Fifty was an informal designation for fifty popular large-cap stocks on the New York Stock Exchange in the 1960s and 1970s that were widely regarded as solid buy and hold growth stocks, or “Blue-chip” stocks. These stocks were considered during that phase as buy and hold as their earnings growth was considered stable for a very long period of time and investors didn’t mind buying them at a very high PE multiple (as shown in the following table) sometimes way above 50x. The long bear market of the 1970s which began with the 1973–74 stock market crash and lasted until 1982 caused valuations of the nifty fifty to fall to low levels along with the rest of the market, with most of these stocks under-performing the broader market averages. In the 1980s, many of these stocks traded at PEx in the low teens after a lost decade in terms of returns.
*Following is the link to my talk at CFA Society India on ‘Buy and Forget’ vs ‘Active Investment Management’ if you are interested in further details.
Earnings Growth and Returns
Most investors have significantly underperformed the strategy of investing in high quality consumer oriented companies in the recent few years. I believe, earnings growth is the lifeline of returns. Key is to find earnings growth without paying exorbitant valuation so that you avoid going through a long stretch of no-returns (10 yrs + after nifty fifty peak). I think Berkshire’s (BRK) history is a great case in point. Warren Buffet’s entry points were generally very low until the 1990s when he created humungous alpha against the S&P 500. He entered Coca Cola at a PEx of 14x in 1988, American Express at 13.5x in 1964, Geico at 4.2x in 1976, General Foods at 6.2x in 1979 and Washington Post at 8.1x in 1973. Entry points were very important for these top holdings.
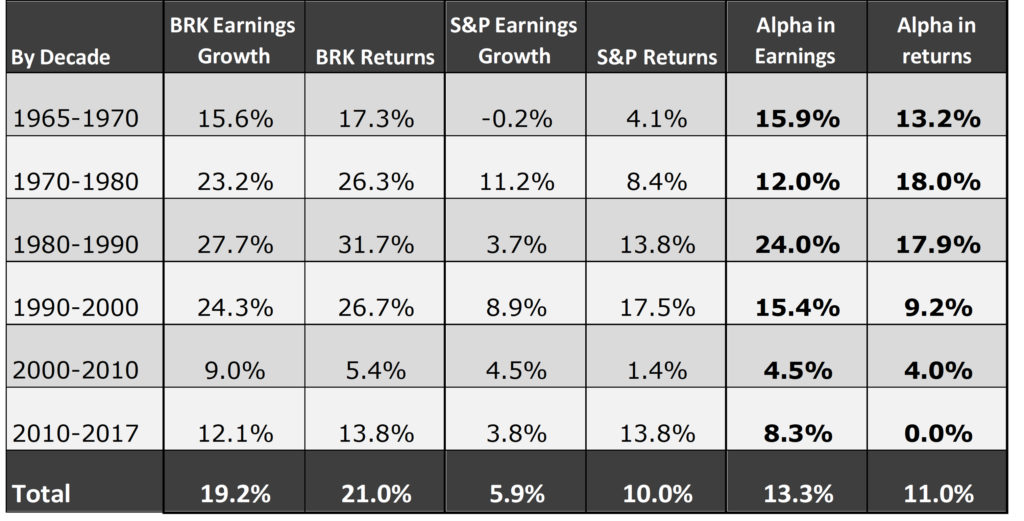
Source: Bloomberg
The above tables show how the superior earnings growth translated entirely in Berkshire’s “Alpha”. Cheap entry valuations made sure that returns didn’t get penalized by de-rating. As churn became difficult with size, it became increasingly difficult to replace existing holdings with high growth companies in the last two decades. It’s similar to running in a race with your hands and legs tied, when smaller players are able to run freely.
Size of AUM (assets under management) acts as gravity on returns for fund managers. As the fund size grows, the universe from which he/she can pick stocks reduces exponentially and drags the performance down. We are well aware of this phenomenon and hence have restricted raising too much funds and especially during bull markets when it’s very easy to do so. Our focus will always remain on earnings growth and maintaining the agility to be able to do so. We expect that our ability to find companies that grow at significantly higher earnings growth rate compared to the market, has delivered alpha and will continue to do so in the long run. We have very little control on the short-term divergence between portfolio fundamental performance and returns. Investors need to be aware of this risk.
Launch of Small/Micro Cap PMS Scheme
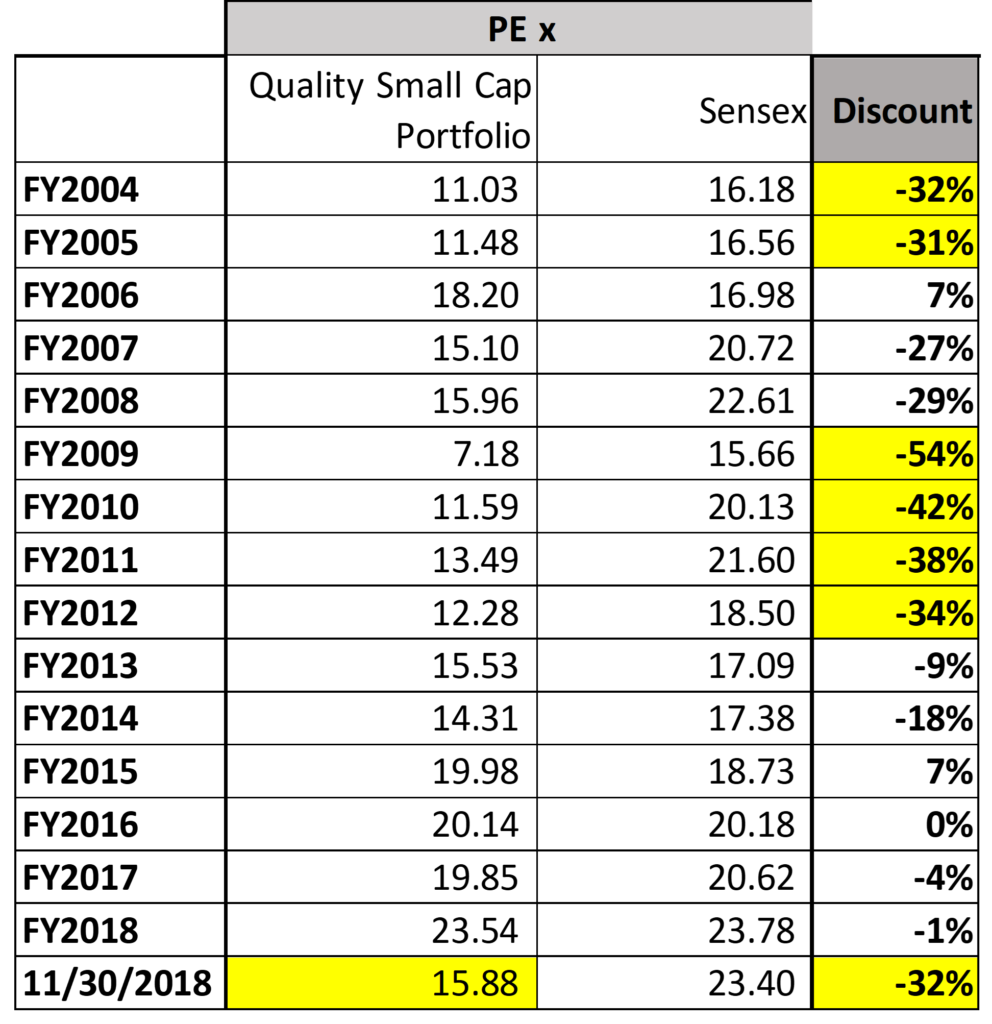
Source: Ace Equity. To construct the quality small cap portfolio, we have passively picked the top 40 companies (based on 3 year average ROE) in the small cap space at the start of each year. This does not represent the actual portfolio.
You must have received communication on our plan to launch a new PMS scheme that will invest in small/micro-cap stocks (90% portfolio between 500 crs to 5000 crs market capitalization) following exactly the same existing investment philosophy. For a fund manager, this space is always attractive but liquidity forces him/her to stay away. We want to limit the fund raise to only 100 crs, so that liquidity isn’t an issue.
After 2018 crash in this space, it is trading at discount (to Sensex or Nifty) not seen since 2012. Such discount existed during the 2009-12 period when one could find great companies (e.g. Bajaj Finance, Amara Raja Batteries, PI Industries, Kajaria Ceramics, Avanti Feeds and many more) well below market cap of 3000 crs and they turned out to be massive multi- baggers. This is the table that shows historical discount of the best companies in this space vs the Sensex.
Even though we already track these smaller companies now, there is no better motivation for us than to be able to invest in the great companies of the future. We hope that as we track these smaller companies even more closely, our effectiveness of picking them early for the core portfolios (SCP & SDP) will increase further.
Warm Regards,
Samit S. Vartak, CFA
Chief Investment Officer (CIO) and Founder
SageOne Investment Advisors LLP
Email: ir@SageOneInvestments.com
Website: www.SageOneInvestments.com

*SageOne Investment Advisors LLP is registered as an Investment Advisor and PMS with SEBI.
Appendices
PMS Portfolio* Performance (Net of Fees)
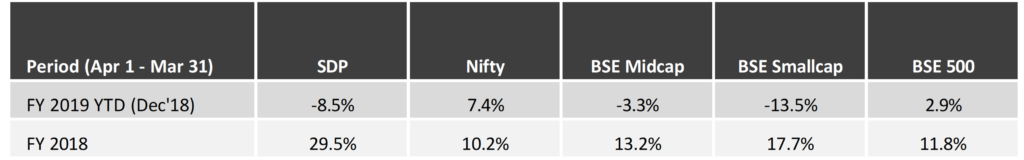
* PMS portfolio is composed of 20 equal weighted stocks. Details of SCP are given below.
Investment Advisory Core Portfolio Performance (Gross Before Fees)
Below is the gross (pre-fees but excluding dividends) performance of our core portfolio in INR terms for the last 9 years and 9 months. For the first three years, we managed proprietary funds and for the last 6 years and 9 months, we have been advising external clients. Since clients have joined at various stages, individual performance may differ slightly based on the timing of purchases. For uniformity and ease, we measure our performance using a “representative” portfolio (that resembles advice given to clients) and we call it SageOne Core Portfolio (SCP). SageOne core portfolio is not a dummy portfolio but the CIO’s actual total equity portfolio.
9 Years 9 Month Gross Performance in INR (Apr 2009 – Dec 2018)
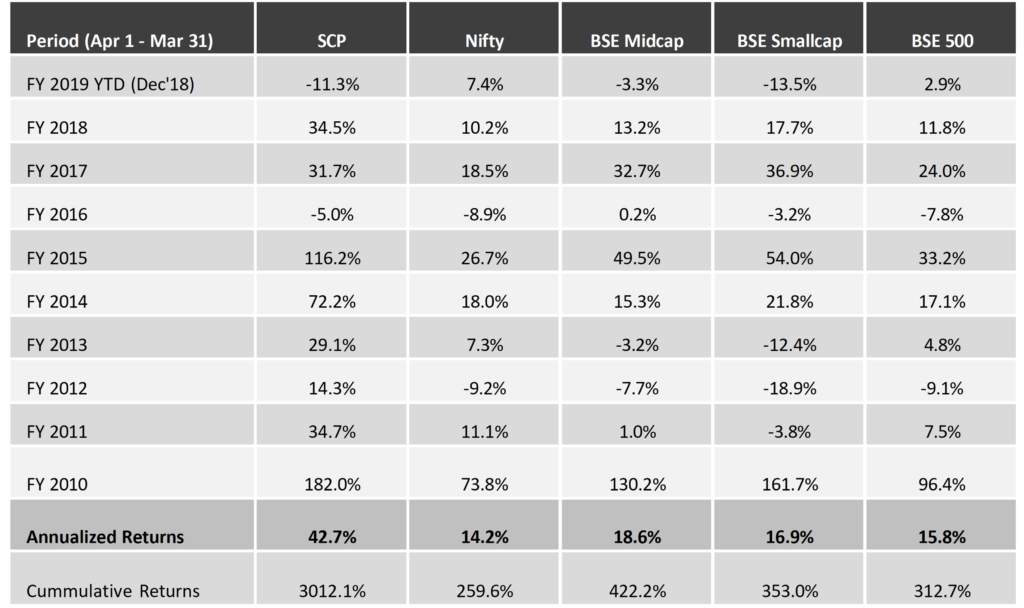
* SCP consists of 14 stocks as of Dec 31, 2018. Investment Advisory and large PMS clients are advised this portfolio.
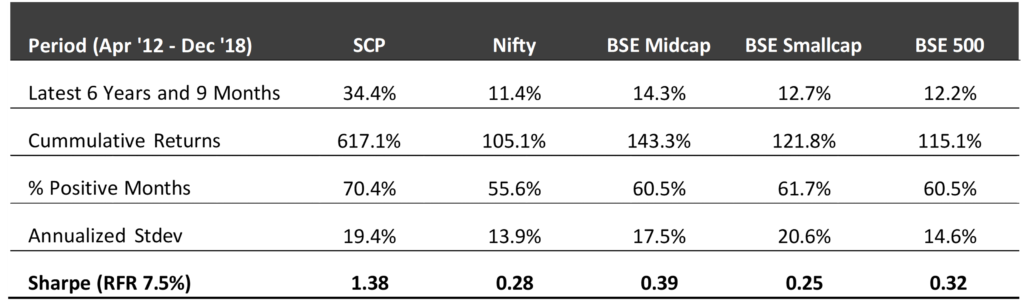
Core Portfolio: Latest 6 Years 9 Months Performance (Apr 2012 – Dec 2018)
First 3 Years Performance (Apr 2009 – Mar 2012)
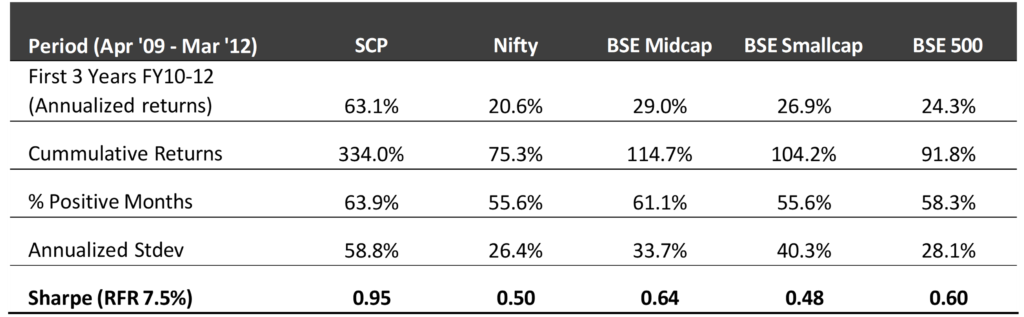
*We have consciously changed the composition of the core portfolio in terms of the average size of companies and the number of stocks in the portfolio after we started advising external clients in April 2012.
*The weighted average size of stocks at the start in FY10 was below $0.25 bn which has increased to nearly $1.3 bn by the end of Dec ’18. Also, the number of stocks has increased from 5 (+/- 2) in 2009 to 14 (+/- 2) during the past 6 years and 6 months.
*Reasonable diversification was done by design to improve liquidity and reduce volatility as a result of which annualized standard deviation has come down from 59% for the first 3 years to 19% during the last 6 years and 9 months.
Legal Information and Disclosures
This note expresses the views of the author as of the date indicated and such views are subject to changes without notice. SageOne has no duty or obligation to update the information contained herein. Further, SageOne makes no representation, and it should not be assumed, that past performance is an indication of future results.
This note is for educational purposes only and should not be used for any other purpose. The information contained herein does not constitute and should not be construed as an offering of advisory services or financial products. Certain information contained herein concerning economic/corporate trends and performance is based on or derived from independent third-party sources. SageOne believes that the sources from which such information has been obtained are reliable; however, it cannot guarantee the accuracy of such information or the assumptions on which such information is based.