
Dear Investor,
At the outset, I wish my new investment memo finds you in good health and sprits.
What an unbelievable start to the year 2020! The alarming rate at which COVID 19 catapulted into a global health crisis brought the whole world to a standstill. This health crisis morphing into an unprecedented global economic crisis has been shocking and painful.
At SageOne, FY20 was looking good until February 2020 wherein we had recovered most of the losses incurred during the mid and small cap crash over the last couple of years and then COVID 19 hit the world and the gains vanished in a matter of few days. For the last one year (as of Apr 30, 2020), indices across large caps to small caps were down. While Nifty 50 was down over 16% during this time, NSE Small-cap 100 and NSE Mid-cap 100 indices dropped by 36.9% and 23.1% respectively.
As value emerged in small caps, our small and micro-cap portfolio (SSP), during these 12 months, was the best performer amongst all our offerings but still down by 3.6% which was better than the NSE small cap 100 index by more than 33%. Our mid/small-cap portfolios – SCP & SDP were down 12.7% and 16.6% respectively, also outperforming albeit by lesser margin. Even though our offerings outperformed the relevant indices by an alpha of 7% to 33%, the negative performance was extremely frustrating.
Unprecedented Times Called for Unprecedented Actions
The volatility and velocity of fall in markets during this crisis caught most of the market participants unprepared. This time we were more cautious than during other crisis and hence took the decision to raise portfolio cash level during the 1st & 2nd week of March. We proactively even communicated this to you with a short note and a conference call. We ended up with cash levels of around 20% across portfolios. The crash was so swift that by 23rd March the markets were down by more than 30% in less than two weeks, fall that generally takes months. We wrote another short note to you indicating that we would be redeploying the cash slowly. At the same time, we took advantage of interim bounce in the market to exit companies which we expect will have difficult times in the changed environment and replaced them with stronger ones which we liked earlier but didn’t meet the valuation threshold then. These were unprecedented decisions taken by us in such a short period of time and indicative of the uncertain and changing environment.
Generally we avoid taking cash calls, but I believe that the tail risks (especially on the negative side) are extremely high this time. I will be brutally honest that I have no idea how this is going to unfold in the next few weeks/months.
I want to be clear on what I mean by tail risk. In a normal recession, we can reasonably predict a range of downside to the economy and the market. Generally GDP may go down by low single digit and markets may go down by 20-60%. In this unprecedented crisis with the experiments governments across the globe are carrying out in terms of complete economic shutdowns and their uncertain durations, it’s almost impossible to estimate the impact on the economy. Tail risk is not an estimation of likely scenario, but an extreme and unlikely (beyond 3 standard deviations or 0.3% probability) scenario playing out and in that case how deep could its impact be on the economies and the markets. E.g. of a scenario would be the Indian banking sector collapsing. We want to be extremely vigilant about it and rest assured that we will intimate you as soon as we believe the probability of such a tail risk playing out increases.
One may ask, why not raise cash levels even higher
My views which I have detailed for India’s growth and banking system are cautious and not so optimistic, but note that these are views on the economy and not necessarily on the equity markets. Markets and economy can follow very different paths (many a times opposite) in the short term just because of the predicting capability of the market. My worries most probably are shared by most market participants and significant part of them may be discounted in the broader market. This is why timing the markets is very tricky.
Worried markets have presented some exciting investment opportunities not seen since 2013. Currently there is big dichotomy between attractiveness of the portfolio companies when looked at from a bottoms up perspective vs the macro situation. (Later in this memo, I have presented an analysis of the historical divergence in valuation across the top 750 companies). If the portfolio was overvalued, it would have made sense to raise cash levels even higher. Also consider the positive risks:
→ World finds a cure and/or vaccine in the next few months. In this scenario, it may not take much time to recover the losses especially given the extraordinary liquidity available in the market
→ During desperate times India is forced to announce game changing reforms
→ As argued by some, India turns out to be a net beneficiary due to low oil prices and potential diversifying of the supply chain away from China.
→ Lockdown is completely lifted quickly and economic activity returns to normal
→ If you recollect the analysis I had presented in my previous memo: Best 1% gaining days of Sensex contributed to 100% (>250x returns) of the gains in the last 40 years. It is risky to miss out on those days especially given the attractive valuations.
Indian markets have returned almost nothing in the last five years. When the BJP government was elected in 2014, most investors (including me) believed strongly that the next 5 years would be very rewarding for the markets. As usual, broad consensus did not play out as expected. The sentiments of investors in India today are almost opposite, very pessimistic and hopeless. It’s a broad consensus that economy would struggle, the government doesn’t have much room for fiscal stimulus, banking sector is in trouble, returning to normal conditions will take months if not years and so on. Most believe the next five years are going to be a struggle for the market. Reality again most likely would surprise us.
What’s Gone Wrong with the India Growth Story?
In the last five years (since Mar’15), the median fall in the 1200 odd companies (covering practically all of India’s listed market cap) has been > 40%, meaning half of the companies are down by more than 40% in the last 5 years. Only about 15% of these companies have delivered double digit CAGR returns and those too have been concentrated in handful of sectors- 28% from Chemical/Pharma, 17% from FMCG/Consumer Durables and 10% from Financial. This period has been very difficult for corporate India with earnings growth (CAGR) of barely 5% and when you consider high stock valuations at the start of this period, the drop in multiples has taken away most of the returns.
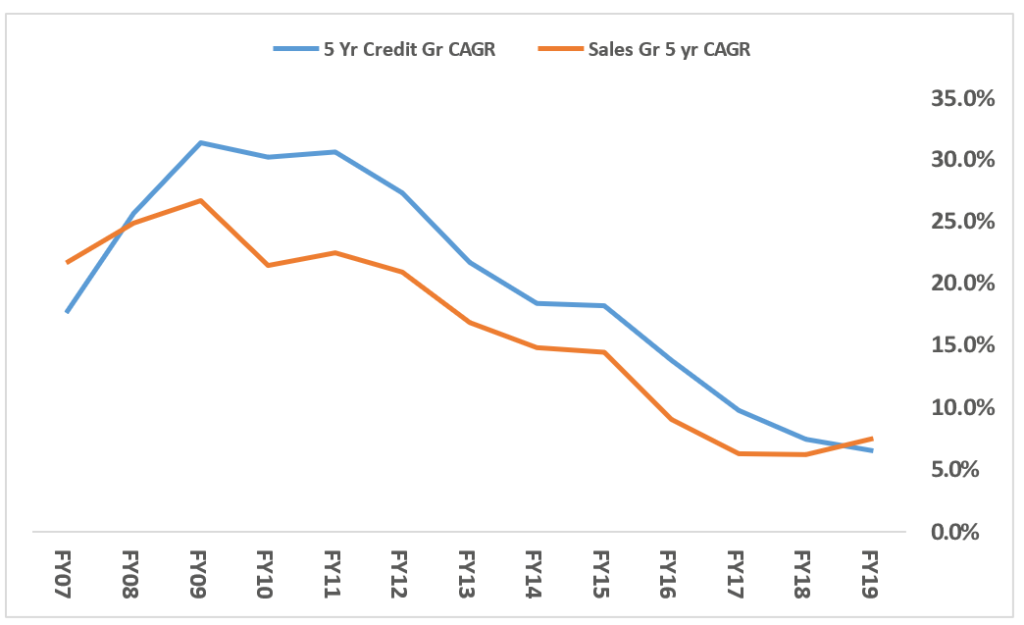
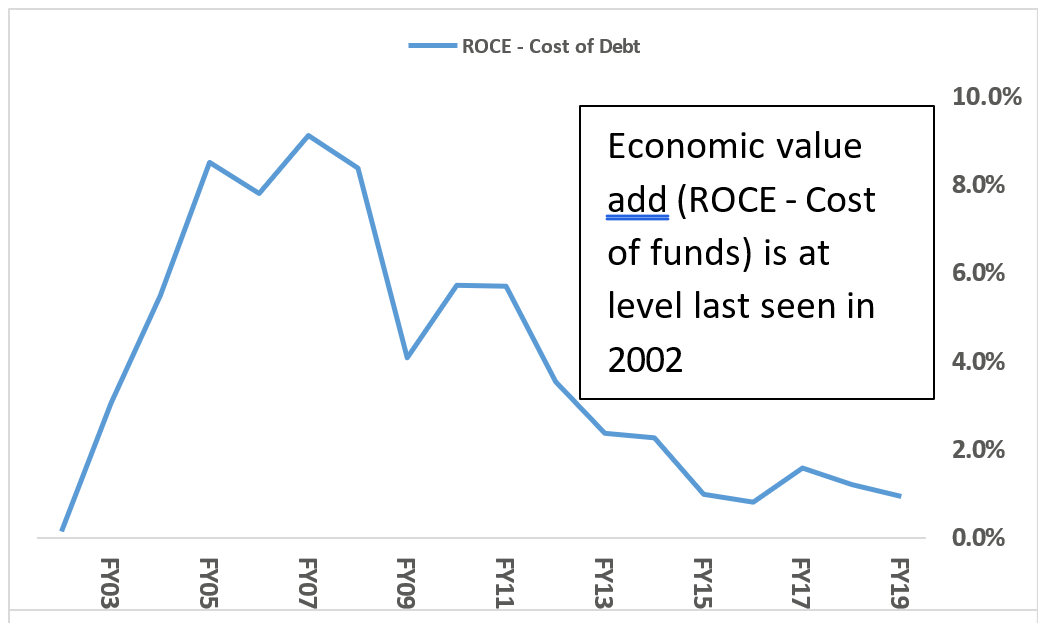
It’s extremely difficult to grow in an environment of lack of credit. As you can see from the chart, credit growth and sales growth are highly correlated. We have analyzed data for the listed non-financial companies in India. The 5 year debt (credit) CAGR which used to be above 20% at the start of this decade has fallen to 6.5% as of FY19. Correspondingly the 5 year sales CAGR for these companies has fallen from 22.5% as of FY11 to 7.5% as of FY19. Profit growth has taken a bigger hit as ROCE has trended downwards from low teens to 8.8%. While ROCE has declined, the cost of debt has risen from around 6% in FY11 to 7.8% by FY19. With these divergent movements in ROCE and cost of debt, the differential between these two have fallen to almost zero over the past 5 years. With such low internal accruals (economic value add) and low credit availability, how does one expect corporate India or the economy to grow?
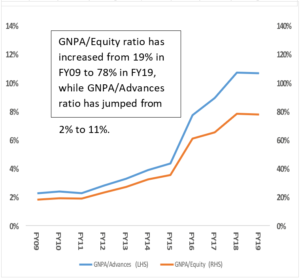
In addition, the banks are in a precarious position. Their gross non- performing assets (GNPA) as a % of advances have jumped from 2% in FY09 to 11% in FY19. Now with the current crisis, situation will get worse. As bad assets got worse, the GNPA/Equity ratio has sharply risen from 19% in FY09 to 78% in FY19. As expected if GNPAs get worse, they probably would cross 100% of equity.
Given this possibility, how does one expect them to not be risk averse? This situation will not change on its own. The government and the RBI will have to step in and help resolve it.
Divergence of Quality vs Rest of the Market. Will it continue?
In such a credit starved environment companies who don’t need any debt, have high profitability (ROCE), high premium of ROCE over their cost of funds and sustainable competitive advantages have done well and will continue to do well. Many of such companies are found in the large cap (LC) space and today they trade at historical premium to the small cap (SC) space.

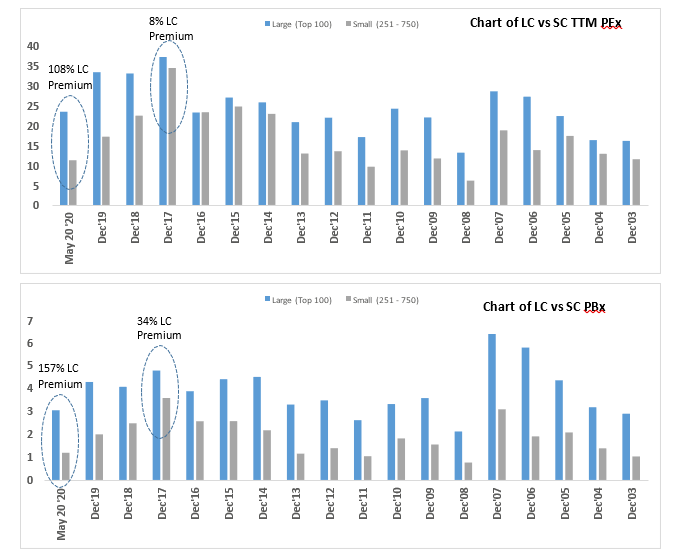
Since Dec’17, earnings growth and valuation of high quality companies and the rest of the universe have diverged and hence the performance has seen a big divergence. Question is whether such this will continue. If you look at the absolute valuation in Dec’17 for both these universes (both at around 35x), there was hardly any gap. Today the LC universe trades at 108% premium (157% in PBx) to the SC universe. The big divergence since Dec’17 in performance of LCs vs SCs has been due to this sharp divergence. Even within the large cap universe, if I filter the top 20 best quality (highest ROCE/ROE and Cash Flow efficiency) companies, their valuation is at >45x which is almost 4x of the small cap median valuation. I would be surprised if going forward, valuation changes will continue driving the divergent performance. In fact, even a tiny indication of economy returning to normalcy could see big rerating of the small cap universe. Good quality SCs have significantly outperformed the LCs even in the last twelve months as can be seen from our SSP performance.
I believe the real opportunity today is to find companies who exhibit the above characteristics with big room for valuation rerating. There are many strong leading/dominant companies that are available at huge discount to their intrinsic as well as historical valuation predominantly in the small cap space. Small cap universe is made up of around 600 companies out of which once you eliminate 2/3rd of poor businesses, you are still left with 200 companies to build a portfolio from. As these are rarely tracked/researched by sell side analyst, if one is good at stock picking he/she can find tremendous value.
In the large cap space the total universe is 100 companies and from these, once you eliminate poor businesses, you are left with 50 companies. Most of these companies are very efficiently tracked/researched and it’s very difficult to find attractive value in this space. In investments,
ONCE YOU TAKE VALUATION OUT OF THE PICTURE, 90% OF THE COMPLEXITY IN BUILDING A PORTFOLIO IS TAKEN AWAY.
If you tell reasonably good investors to build a portfolio of 20 best quality companies from the above 50, I would say that 70% (if not more) of the companies would be common. This strategy of picking the best quality companies has significantly outperformed any other strategy in the recent couple of years. Such easy portfolio identification strategy can’t keep delivering Alpha for long as valuations reach unsustainable levels.
Launching Our Large Cap Passive Strategy (SLP)
Our passion as well as expertise is in picking good quality, high growth businesses available at attractive valuations. It’s very difficult to find such a combination in the large cap space and hence our portfolios have largely been small and mid-cap biased. Even though we have outperformed all major Indian indices in the long-term, in the last two years, this strategy has significantly underperformed the super quality large cap companies bought at any valuation. As I said earlier, I don’t think one needs an active fund manager to build such a portfolio especially one that charges high fees. Most of possible alpha can be easily generated by well- designed passive strategy/formula.
We evaluated and back-tested combination of various parameters (profitability, growth, valuation, cash flow, dividend payout, etc.) over the last 19 years which covers three different cycles (2002-2008, 2009-2013, 2014-2019) and narrowed down on parameters which provided the best risk adjusted returns across all the three cycles. More importantly it generated a 23% annualized returns and gross annual alpha (against Nifty 50) of over 10% during these 19 years. Hence we launched SLP at a very low fee structure (expenses as a fund house are extremely limited) and a potential alternative to clients allocation in ETFs, large cap MFs and actively managed large cap PMSs. Low fee options include zero fees in years when we don’t beat the Nifty 50 or when portfolio is negative. Key points to note on this strategy:
→ Being a passive strategy and in the most efficient space, the investment team would not be spending time on management interaction, ground level supply chain research or plant visits that we do for our active strategy
→ From the top 100 universe, we eliminated companies with poor businesses and promoter quality based on our team’s collective experience and thorough screening
→ From the remaining 50, pick the best 16 businesses based on our thoroughly back tested formula/parameters
→ Keep close watch on any corporate governance issues and in absence of any related exits evaluate the portfolio for any changes once a year
I want to reiterate that our core strength is to pick businesses that are strong but available at attractive valuations as they are under researched. An active fund management team can add a lot of value by doing thorough ground work. We will continue looking for such high growth (>20%) companies at reasonable valuation in our active strategies.
The large cap passive portfolio is almost a contra to our active strategies and likely to be comprised of average growth (8-15%) companies at high valuations. 85% of the institutional money is invested in these largest 100 companies. Our large cap offering is a time tested intelligent alpha strategy with minimal fee structure.
Compounding impact of high fees can be significant. For e.g. if an investor invests 1cr for 10 years in two funds with fee differential of 1.25%. Assuming similar gross returns (but net returns of 15% vs 13.75%) the difference in net amount at the end of 10 years is almost 42 lacs i.e. 42% of contributed capital.
Road Ahead
The prolonged shutdown enforced by the governments across the globe is the real black swan event. India unfortunately is not in a position to afford such an expensive experiment. No amount of stimulus will be able to make up for the losses suffered by corporate India, the banking sector and the general population. The biggest stimulus and the only feasible one would be to open up the entire country at the earliest with necessary precautions. Even with immediate opening up, for the economy to come out of the growth slump we need a strong banking sector which can fund growth. I hope the precarious current status would force the government to open up various sectors for investments, lay a red carpet for new companies to set up operations, make doing business easy in reality (not only on paper) and let go of the litigations/harassments even if it costs us few billion dollars. It’s very important to awaken the animal spirits which are as good as dead currently. I hope this is done for India’s sake.
From an investment perspective, there are many mouthwatering opportunities. You are able to find good quality companies who can double their earnings in the next 3-4 years and still available at low teen multiples. Such companies probably will also see their valuations rerate significantly over that period. They have the potential to generate 3-4x returns over this horizon. These kind of returns seem high now but are typical of bounces from lows for the small cap space. E.g. 2003 (11-12x), 2009 (4x) and 2013 (4x).
Environment surely seems bleak at the moment, but as we have done in the past, India will bounce back from the crisis stronger. Once you get even an inkling of such revival, these attractive prices would be only in our memories.
Warm Regards,
Samit S. Vartak, CFA
Founder and Chief Investment Officer (CIO)
SageOne Investment Advisors LLP
Email: ir@SageOneInvestments.com
Website: www.SageOneInvestments.com

*SageOne Investment Advisors LLP is registered as an Investment Advisor, PMS and AIF with SEBI.
Appendix – 1
SSP Portfolio* Performance (Net of Fees)
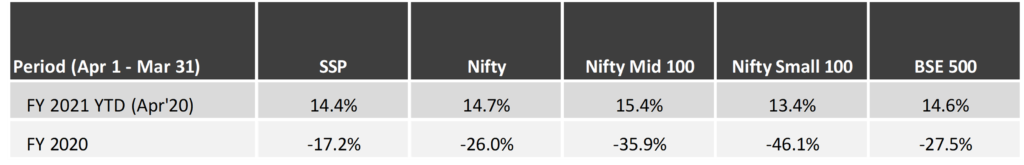
Source: SageOne Investment Advisors, Bloomberg, Wealth Spectrum
*SSP (SageOne Small&MicroCap Portfolio) portfolio is composed of 12-20 equal weighted stocks with Mcap ranging from 500 cr to 5000 cr. This scheme was launched last year. Average Map 2,400 cr
SDP Portfolio* Performance (Net of Fees)
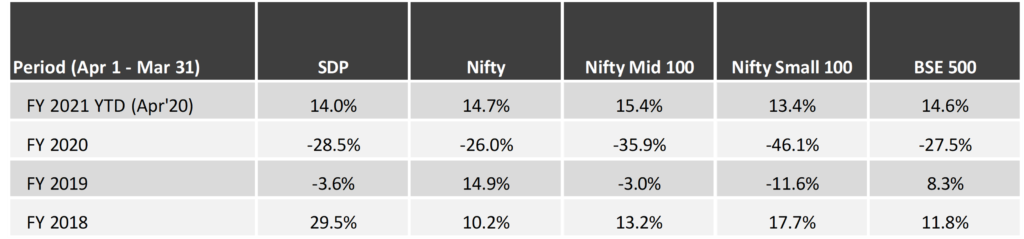
Source: SageOne Investment Advisors, Bloomberg, Wealth Spectrum
*SDP consists of 22 stocks as of Apr 30, 2020. Average Mcap 9,200 cr.
SageOne Core Portfolio (SCP) Performance (Net of Fees)
For the first three years, we managed proprietary funds and for the last 8 years and 1 month, we have been advising/managing funds for external clients. Since clients have joined at various stages, individual performance may differ slightly based on the timing of purchases. For uniformity and ease, we measured our IA performance using a “representative” portfolio (that resembles advice given to clients) and we call it SageOne Core Portfolio (SCP). SageOne core portfolio is not a dummy/theoretical portfolio but the CIO’s actual total equity portfolio. The representative portfolio until FY17 was reviewed by KPMG. Post that the performance is for the PMS scheme. Calculated on a TWRR basis for the entire period.
11 Years 1 Month Performance in INR (Apr 2009 – Apr 2020)
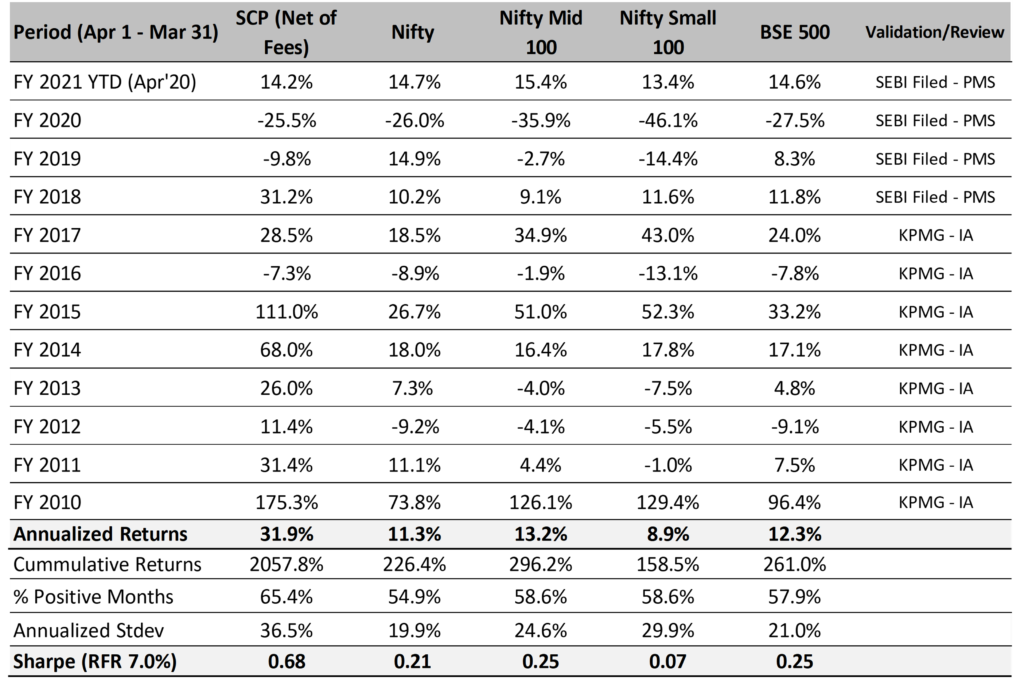
Source: SageOne Investment Advisors, Bloomberg, Wealth Spectrum
* SCP consists of 15 stocks as of Apr 30, 2020. Average Mcap 11,600 cr.
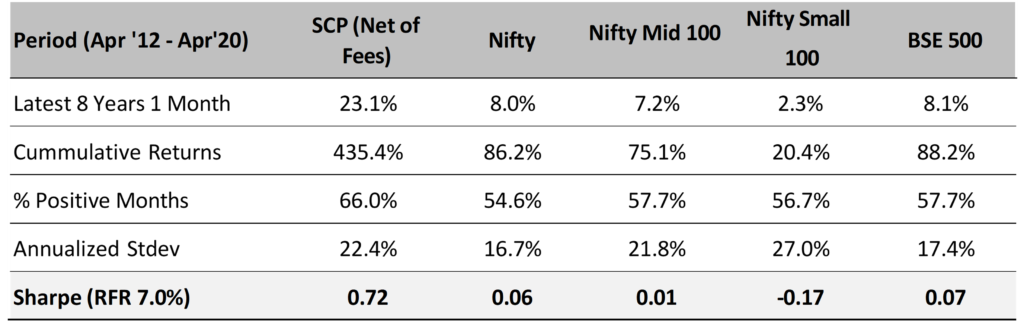
SCP: Latest 8 Years 1 Month Performance (Apr 2012 – Apr 2020)
SCP: First 3 Years Performance (Apr 2009 – Mar 2012)

*We have consciously changed the composition of the core portfolio in terms of the average size of companies and the number of stocks in the portfolio after we started advising external clients in April 2012.
*The weighted average size of stocks at the start in FY10 was below $0.25 bn which has increased to nearly $1.5 bn by the end of Apr ’20. Also, the number of stocks has increased from 5 (+/- 2) in 2009 to 14 (+/- 2) during the past 8 years and 1 month.
*Reasonable diversification was done by design to improve liquidity and reduce volatility as a result of which annualized standard deviation has come down from 59% for the first 3 years to 22% during the last 8 years and 1 month
Legal Information and Disclosures
Any performance related information provided above is not verified by SEBI.
This note expresses the views of the author as of the date indicated and such views are subject to changes without notice. SageOne has no duty or obligation to update the information contained herein. Further, SageOne makes no representation, and it should not be assumed, that past performance is an indication of future results.
This note is for educational purposes only and should not be used for any other purpose. The information contained herein does not constitute and should not be construed as an offering of advisory services or financial products. Certain information contained herein concerning economic/corporate trends and performance is based on or derived from independent third-party sources. SageOne believes that the sources from which such information has been obtained are reliable; however, it cannot guarantee the accuracy of such information or the assumptions on which such information is based.