
Dear Investor,
As I write this memo, India is in the grips of a ferocious COVID 19 second wave. My heart goes out to all the families who have lost someone to this potent virus and many more who are still fighting for their lives. It has been heartwarming to see so many of us going all out to help fellow citizens in whatever way we can. Experience of such altruistic acts is sublime. Hope we keep this spirit beyond COVID 19 and continue lifting each other up.
On the investment front, the markets continue to hit all-time highs even against the above backdrop. I have in my past memos (Feb’21) written extensively about such disconnect and one should not be surprised. I am glad to see our portfolios continue to outperform the markets post Mar’20 even with us having minimal exposure to cyclical/commodity sectors. During such periods it’s very difficult to avoid greed of taking short term bets, but we have stuck with what we understand best. Of course one has to take such decisions consciously with an open mind to opportunities. In this memo I have presented an analysis on the performance of cyclical vs structural sectors over the past 20 years and why we have decided to stay away. In addition, I have also shared my views on where we are in terms of the market risks/rewards. First let me briefly cover how FY2021 (Apr’20-Mar’21) was for us. Detailed tables are provided in the Appendix at the end.
SageOne Portfolio Performances (Net of Fees) for FY 2021
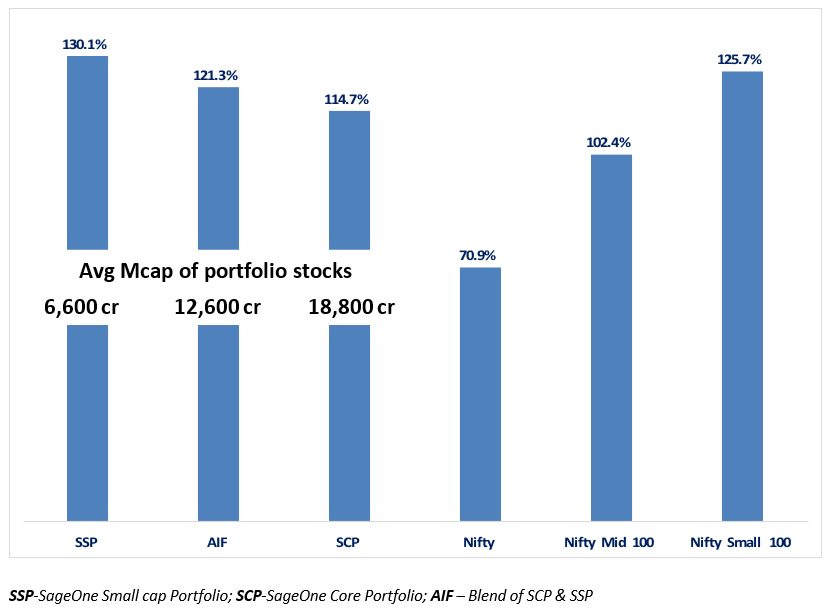
I am happy that we have achieved the above performance by not deviating from our strategy. We also stayed away from micro-cap companies which can rise sharply but where liquidity can be a big risk for open ended strategies like ours. In the above graph I have mentioned the average market capitalization (as of April’21) of companies in each portfolio as a reference. In addition to the above short term charts, long term performance is presented below.
SageOne Portfolio Performances (Net of Fees) since Respective Inceptions
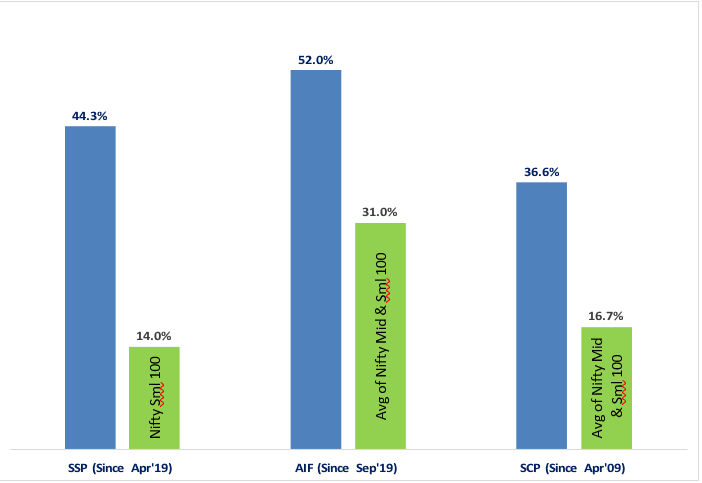
Liquidity is always a key metric for us and hence we are careful about the amount of AUM we manage in each strategy. For our small cap fund (SSP) we are close to the limit we planned to raise when we launched this scheme at the start of 2019 and hence are closing it for new investors from June 1, 2021. In the small cap space, fund size can be a big drag on a fund manager’s ability to deliver superior returns mainly because the universe of stocks one can invest in shrinks exponentially with size. Please note, it is liquidity and not valuation concerns that made us take this decision.
Where Are We Currently?
Major indices may not indicate how sharp and how broad the rally has been in FY21 and beyond. Below table shows how equal weighted portfolios have done in each of the quintile of the BSE 500 companies. For historical perspective, I have also provided similar tables for BSE 500 from periods just before the two major market peaks (2008 and 2018). As you can see, there is no question that we are stretched on valuations across the board and currently at levels similar to the two previous peaks. Does this mean that we are staring at a big crash in the coming months?
BSE 500 Performance (April 1, 2020 to May 18, 2021) and Current Valuations*
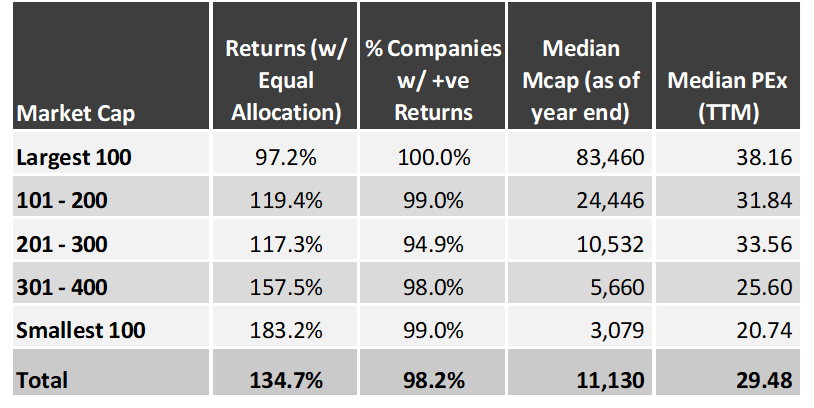
* Note that latest balance sheet data isn’t yet available for most companies and hence I have not presented relevant ratios such as ROE, CFO/PAT etc. Source: Ace Equity
BSE 500 Performance/Valuations before Last Two Major Peaks

Another way to see how broad the market rally has been can be seen from the jump in stock prices since the bottom on Mar 23rd 2020 over the last 14 months. I have also provided a comparison with the rally from the Mar 9th 2009 bottom which lasted for 18 months. While the extent of the current rally is far away from what we saw in 2009, note that the fall in Nifty 50 index before the rally was above 55% in 2008-09 vs 35% in 2020.
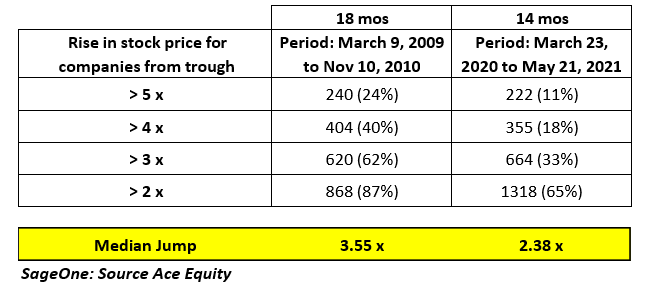
SageOne: Source Ace Equity
Time to be Cautious
Just because numbers look similar to previous times, doesn’t mean the future is going to be similar and the markets are going to crash. Markets are too complex to draw such simple conclusions. One of the biggest differences between the 2008/2018 and now is the quality of corporate balance sheets in terms of leverage and cash flow generation. For more details, do refer to my Feb’21 memo wherein I had presented detailed analysis on it and balance sheets have only improved further since then. This doesn’t mean that we can be complacent. On the contrary when valuations are high, there is very little room for error and one has to be very careful in choosing companies for one’s portfolio.
Today even companies in the hated pockets such as cyclical/commodities have gone up multiple times even from the pre COVID levels. Compounding/Quality companies were already expensive and continue to remain so. In such an environment, it is extremely difficult to find any undervalued pockets. Rising markets are very forgiving and hide many investing mistakes. In a good business environment (like what we are having over the past 2-3 quarters), many companies deliver high growth rate and investors tend to give benefit of doubt to a large set of companies driving their stock prices. Over a business cycle, less than 10% of the companies have delivered > 20% annualized earnings growth (analysis presented in Feb’18 memo) in the Indian market. In the short run, stock prices of all companies go up, but very few of them would be able to support those with sustainable earnings growth. That’s where the difficult part of investing comes in which separates the wheat from the chaff. When the tide turns, there is a sprint to exit and investors end up losing majority of the gains that they piled up during good times.
Our strategy is to only invest in companies where, based on our analysis, the companies would be able to double their earnings over the next 3-4 years. We are fine compromising (a bit) on valuations, but cannot afford to compromise on the businesses we invest in. I am cautious in the short run, but bullish over the next 2-3 years as even today we are able to find many exciting businesses which exhibit long term structural growth trends. We continue to maintain a balance between domestic and export oriented themes and not rely solely on the Indian economy doing well. This is not the time to bet on hope.
We may not bounce back similar to how we did after the first wave. Then, the inventory was at low cost and after the economy opened up, prices shot up thereby increasing corporate margins. Today the inventory is at high cost and increasing or even maintaining recent margins may be difficult. Earnings growth may have to come more from volume growth rather than profit margin increase. We should be prepared for downward surprises.
Economically sensitive sectors such as metals and other commodities have been on a tear recently. Not having exposure to such sectors in your portfolio has resulted in huge underperformance for many over the past 14 months. This can tempt many to join the momentum even if it doesn’t fit in your philosophy and even if you have very little understanding of the commodity businesses/cycles. We have and will stay away from such temptation. As you know, we rely on a lot of data analysis and even in this situation we did multiple analyses to aid our decision making. Let me present few findings.
Cyclical vs Structural Sector Performance over 20 years
For this analysis, I have considered the top 1000 companies having history for the last 20 years i.e. since FY2001. I have done this for all the sectors, but for the current purpose presenting the divergent performance of three sectors viz. Consumption, Metals and Pharma/Chemicals for this period. I consider Metals to be a cyclical sector and the remaining two structural as they have had structural and consistent growth over the last few decades. Below is the performance of these three sectors in terms of Sales, Net Profits and Market Capitalization from FY2001 to May’21. FY2001 was a year when many metal companies were in a brutal down cycle and that low starting point has helped them show as good a growth as other two sectors. Hence I have shown performance over various periods: last 15 years, since Jan 2008 peak, last 10 years and last 1 year.
Comparison of a Cyclical Sector vs Two Structural Growth Sectors
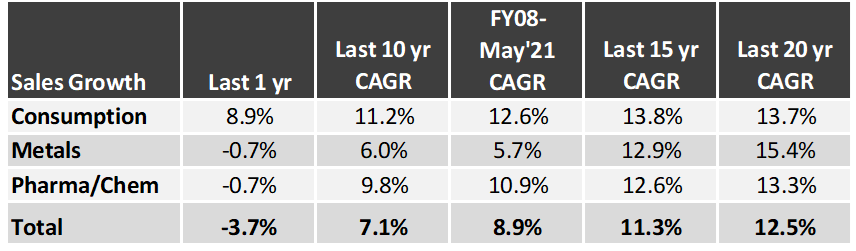
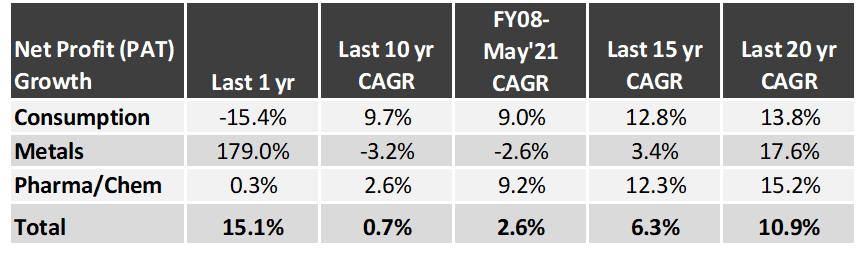

Note that “Total” is for all Top 1000 companies in the analysis and not just for the 3 sectors. Source: Ace Equity
→ Surprisingly Metals have done as well as the other two in terms of all the 3 parameters since FY2001
→ FY2001 was the trough of the Metal cycle and FY2021 can be considered to be closer to the peak. If we look at a Peak (Jan’08) to Peak (May’21) period, Metals have significantly underperformed the other two sectors
→ Last 1 year has seen a phenomenal rise (multiple times of the other two) in profitability and market capitalization of Metals
Depending on the periods we choose to do the analysis, the results can be drastically different. If we had done similar analysis a year ago, the tables would have looked very different.
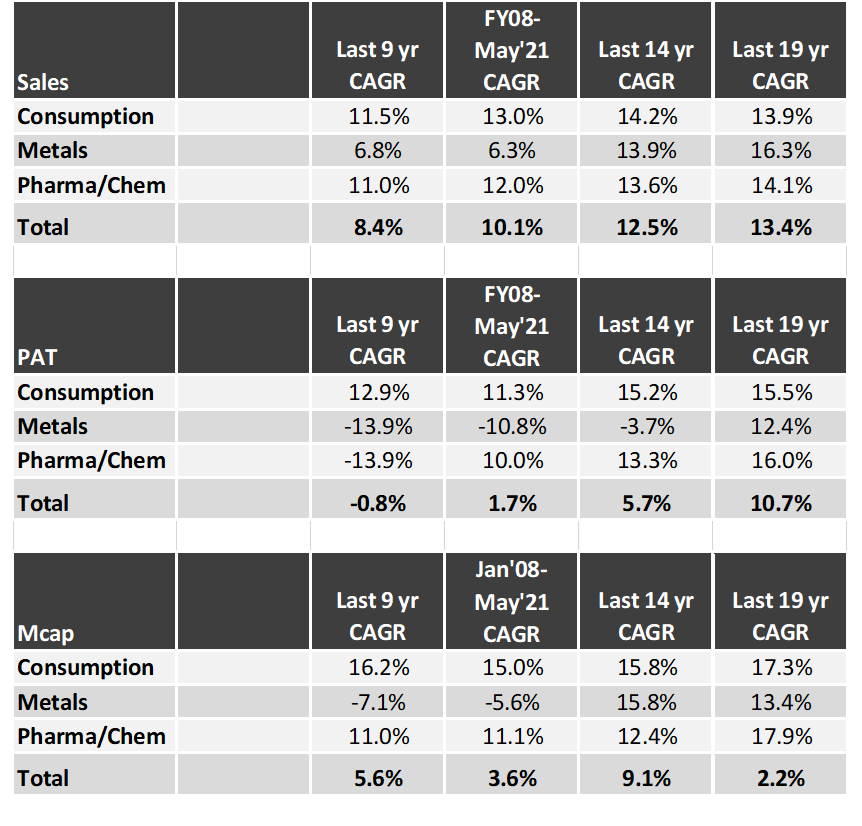
As you can see, the picture has flipped within a year. Last year you would have noted that:
→ Metals significantly underperformed the other two sectors across timelines and were down almost 50% on a cumulative basis over the last 9 years as well as since Jan’08.
→ The drawdown in Metals was almost 80% after the Jan’08 peak and was amongst the deepest across sectors
→ Metals returned 20x from FY01 to Jan’08 vs around 3x and 6x for the Consumption and Pharma/Chemicals sectors respectively, but then gave up 16x of it quickly
As you can see that in phases like the recent past and FY01-08, cyclical sectors can deliver returns of your lifetime if you are able to time your entry and exit. The key factor here is “Timing” and very few have the required skills to do it consistently. Even investors who track these sectors very closely and understand these businesses deeply, can often get trapped in false starts. Lesser mortals like us have very little chance of getting just that one real cycle right. Most fund managers would have vanished by holding such cyclicals during the period post FY08. The longer you stay away from them, the lesser you understand the businesses and hence the skill to time the entry and exit.
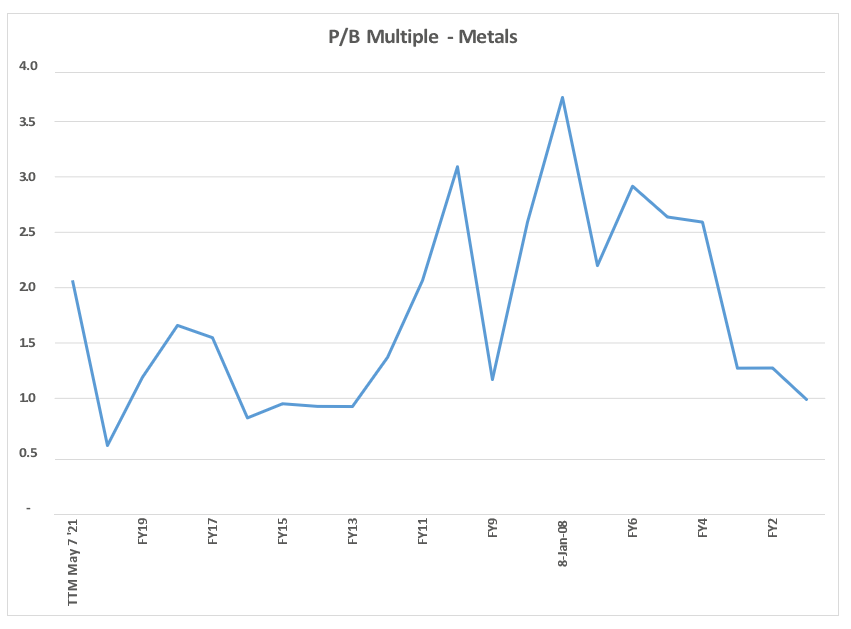
Even this time, predicting that this is the start of a long upcycle would be gutsy. Factors such as pent-up demand, container shortage, supply shortage and exponential rise in shipping costs can influence commodity prices sharply in the short run. In addition, liquidity in the financial markets and speculative positions in the futures/derivatives markets take prices to extremes very quickly. Without deep business understanding, making sense of valuation (see chart) is tricky. For us, it’s an impossible task to make sense of these moving parts. We better stick to what we can make sense of.
In spite of the current difficult situation in India, I am very bullish on India and our entrepreneurs. We have world class promoters with exceptional execution track record and global ambition. The investment opportunities they present are exciting. To reap benefits, investors would need patience and temperament to take the volatility that lies ahead. All the very best.
Warm Regards,
Samit S. Vartak, CFA
Founder and Chief Investment Officer (CIO)
SageOne Investment Managers LLP
Email: ir@SageOneInvestments.com
Website: www.SageOneInvestments.com

*SageOne Investment Managers LLP is registered as a PMS and an AIF with SEBI.
Appendix
SSP Portfolio* Performance (Net of Fees)
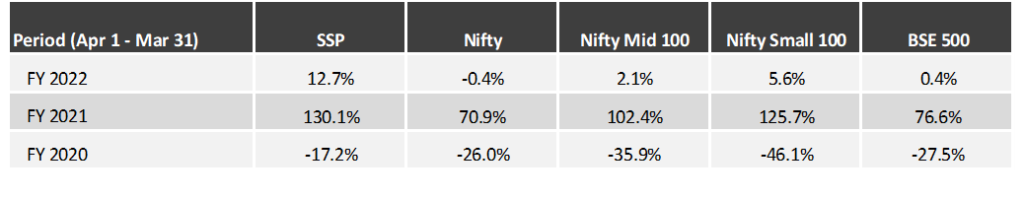
Source: SageOne Investment Managers, Bloomberg, Wealth Spectrum
*SSP (SageOne Small&MicroCap Portfolio) portfolio is composed of 12-20 stocks with Mcap ranging from 500 cr to 5000 cr at entry. This scheme was launched last year. Average Map as of Apr 30, 2021 was 6,600 cr
SDP Portfolio* Performance (Net of Fees)
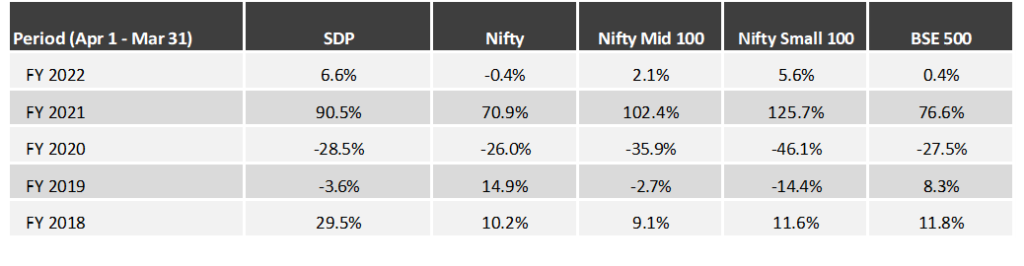
Source: SageOne Investment Managers, Bloomberg, Wealth Spectrum
*SDP consists of 22 equal weighted stocks as of Apr 30, 2021. Average Mcap 16,200 cr
SageOne Core Portfolio (SCP) Performance (Net of Fees)
For the first three years, we managed proprietary funds and for the last 9 years and 1 month, we have been advising/managing funds for external clients. Since clients have joined at various stages, individual performance may differ slightly based on the timing of purchases. For uniformity and ease, we measured our IA performance using a “representative” portfolio (that resembles advice given to clients) and we call it SageOne Core Portfolio (SCP). SageOne core portfolio is not a dummy/theoretical portfolio but the CIO’s actual total equity portfolio. The representative portfolio until FY17 was reviewed by KPMG. Post that the performance is for the PMS scheme. Calculated on a TWRR basis for the entire period.
12 Years 1 Month Performance in INR (Apr 2009 – Apr 2021)

Source: SageOne Investment Managers, Bloomberg, Wealth Spectrum
* SCP consists of 15 stocks as of Apr 30, 2021. Average Mcap 18,800 cr
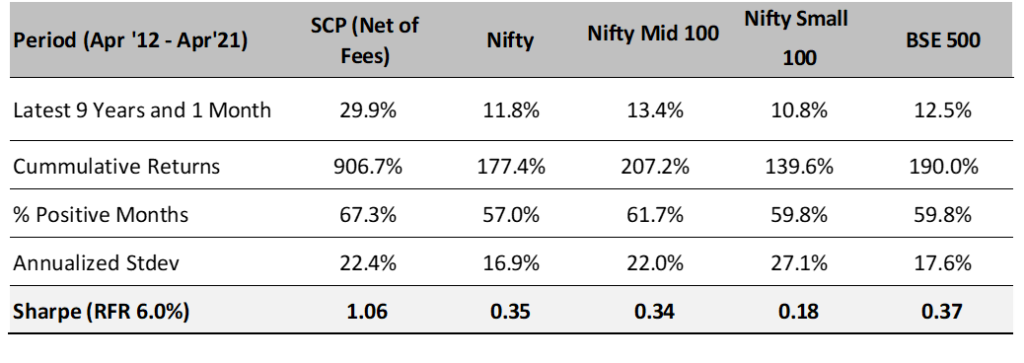
SCP: Latest 9 Years 1 Month Performance (Apr 2012 – Apr 2021)
SCP: First 3 Years Performance (Apr 2009 – Mar 2012)
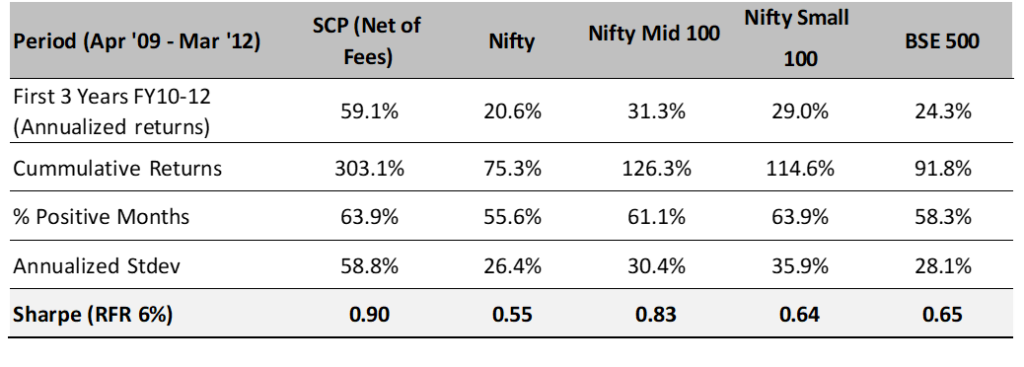
*We have consciously changed the composition of the core portfolio in terms of the average size of companies and the number of stocks in the portfolio after we started advising external clients in April 2012.
*The weighted average size of stocks at the start in FY10 was below $0.25 bn which has increased to nearly $2.50 bn by the end of Apr ’21.
Also, the number of stocks has increased from 5 (+/- 2) in 2009 to 14 (+/- 2) during the past 9 years and 1 month. a result of which annualized standard deviation has come down from 59% for the first 3 years to 22% during the last 8 years and 4 months
Legal Information and Disclosures
Any performance related information provided above is not verified by SEBI.
This note expresses the views of the author as of the date indicated and such views are subject to changes without notice. SageOne has no duty or obligation to update the information contained herein. Further, SageOne makes no representation, and it should not be assumed, that past performance is an indication of future results.
This note is for educational purposes only and should not be used for any other purpose. The information contained herein does not constitute and should not be construed as an offering of advisory services or financial products. Certain information contained herein concerning economic/corporate trends and performance is based on or derived from independent third-party sources. SageOne believes that the sources from which such information has been obtained are reliable; however, it cannot guarantee the accuracy of such information or the assumptions on which such information is based.