
Dear Investor,
CY2021 was second year in a row of superior returns for the Indian equity markets. Almost 80% of the BSE500 companies delivered positive returns and the returns were inversely proportionate to the size of the company i.e. the smaller the market value of the company, the higher were the returns on an average. We have gone through many such cycles where the higher the risk you take, the higher the returns are. These are the times where it becomes extremely difficult to differentiate between skill and risk taken. We will only know (in hindsight) after the tide turns who was swimming naked. Until that point, everyone would believe that he/she is fully skilled. We are no differentJ, though markets have made us eat humble pie many a times over the past two plus decades and hence we remain introspective.
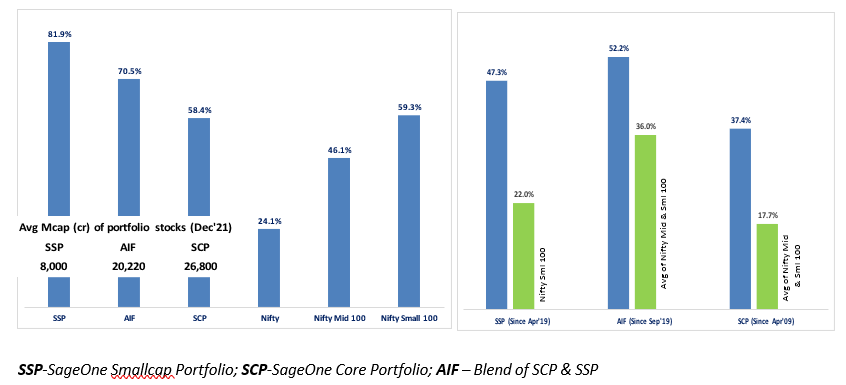
Our small cap portfolio (SSP) has delivered 81.9% returns in CY2021 after delivering 61.3% in CY2020. Our flagship portfolio SCP was up 58.4% in CY2021 and has delivered 50% plus returns for the fourth time in the last 10 years. Our AIF is a blend of the above two portfolios delivering 70.5% for CY2021. What has given us satisfaction is that we have continued holding on to superior businesses identified pre-COVID. Many of them have performed beyond our expectations on earnings growth front and we have not swayed away from our strategy. Our portfolios have experienced significantly lower drawdowns vs their respective benchmarks and I believe it’s a reflection of the relative resilience of the businesses we hold.
We can’t afford to be complacent in such times just because these businesses have delivered in the past. We continue to meticulously evaluate each business in our portfolio to sustain confidence that they are well placed to meet our expectations over the next 2-3 years. As a fund manager who keeps getting funds at all times, it’s important to make sure that the companies we hold still remain attractive buys for the new investors. Below is the performance of our active portfolios for CY2021 and since respective inception. Detailed tables are provided in the Appendix at the end.
SageOne CY2021 and ‘Inception to Date’ Performance (Net of Fees)
Have the India Equity Markets Peaked and is a Crash Imminent?
I believe that the biggest risk to the equity markets is when multiple factors such as high valuation, growth in GDP/corporate earnings/private capex/credit, receivable days, debt/equity ratio and high profit margins are near historical highs. Today other than valuation, most other factors are near lows or at average. Even on valuation front, the multiples based on P&L earnings such as PE or EV/EBIDTA may be near highs, but the more predictive multiples such as PB or EV/CFO are near historical long-term average. I had presented a long term table of the balance sheet ratios in my last memo (link). Most of the above factors indicate that we are fundamentally close to the bottom of an economic cycle and my experience has been that markets don’t go through a big crash in such an environment with extremely strong corporate balance sheet. However, a very common 15%-20% correction can happen anytime.
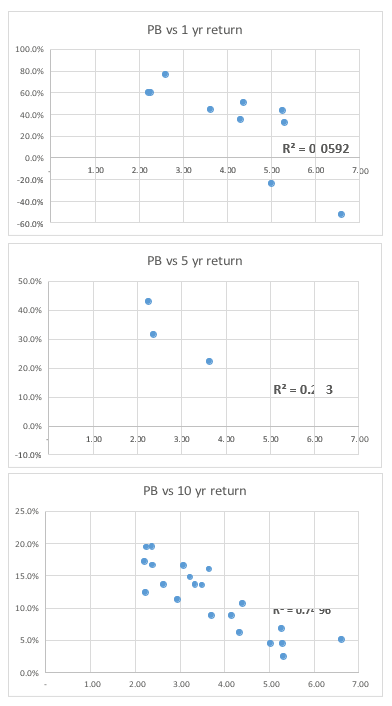
After such a strong jump in equities from the COVID crash, it’s natural to fear a big drop in the short term especially when the commonly followed valuation multiple are near highs. In reality, data suggests that there is very little predictability of valuations multiples for near term returns. The most reliable valuation predictor in India as well as the world has been the PB (price to book) multiple. Adjuacent are the charts and correlation parameters between this multiple and the subsequent returns for the Sensex index. R2 is a statistical measure that explains what % of returns are explained by PB. As you can see from the first graph that PB and 1 yr return have no pattern and hence R2 is below 6% or just a random dot plot. Even 5 yr return has a very weak relationship at below 25%. You can see in the 2nd graph that at PB between 2 and 3, the returns over the next 5 years have ranged from below 0% to above 40%. Only for longer term time horizon like 10 yr the R2 is at 75% which is a statistically significant relationship.
I understand that we get a strong urge to predict short-term movements of the stock market and we may fear big drops especially in the small/mid cap space after sharp jumps, but even there the predictability is extremely poor in the short term. We do get influenced a lot due to the recency bias (sharp drops for the small cap indices in 2008-09, 2012-13, 2018-19). Unless one has the exceptional ability of successfully timing the markets repeatedly, I believe it’s a futile effort to try and predict such drops. Changing the asset allocation to handle your worry might be a more effective strategy to ride through volatility without taking the risk of completely sitting out of a possible major bull run.
Another way of handling the worry of losing capital is by having a long enough holding period. The longer the holding period, the lower is the probability of incurring a loss. Below is a statistic for Sensex (since 1979) and our portfolios since their respective inception dates. Please note that for simplicity of calculations, the measurement period for rolling 1 yr, 5 yr and 10 yr returns is only one date i.e. December 10th and hence the results would be slightly different if the rolling returns are calculated on a daily basis.
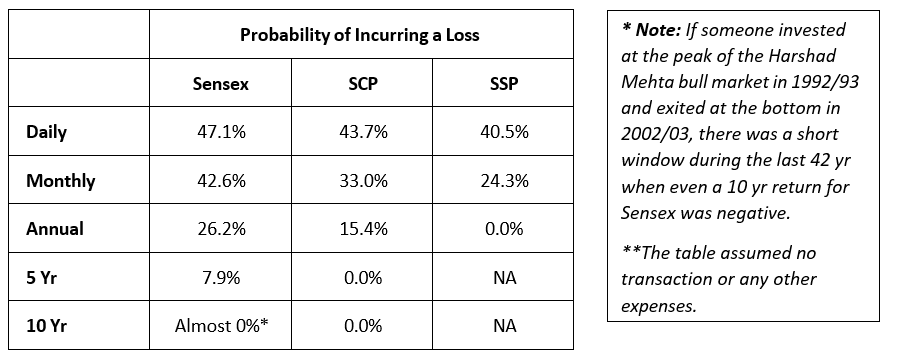
The above table shows that there is a 47% probability of losing money on a daily basis, but if you invest for a period of at least one year the probability of loss drops to 26%. The probability keeps dropping as your investment horizon stretches further. This is at the index level, but such probabilities can be further reduced with an appropriate investment strategy and execution.
India Stands Out Against the Global Backdrop
India is generally considered to be a Beta market in the global context. This typically means that FIIs over allocate to India when it’s a “risk on” environment for higher Beta and lower their allocation when it’s a “risk off” environment. I believe this time India is positioned to be an Alpha market, meaning that it is positioned to outperform other major markets based on earnings growth. We experienced the start of this phenomena in 2021 when majority of emerging markets underperformed India by a wide margin even though FIIs aggressively exited Indian listed markets assuming historical correlation.
The Supply Side
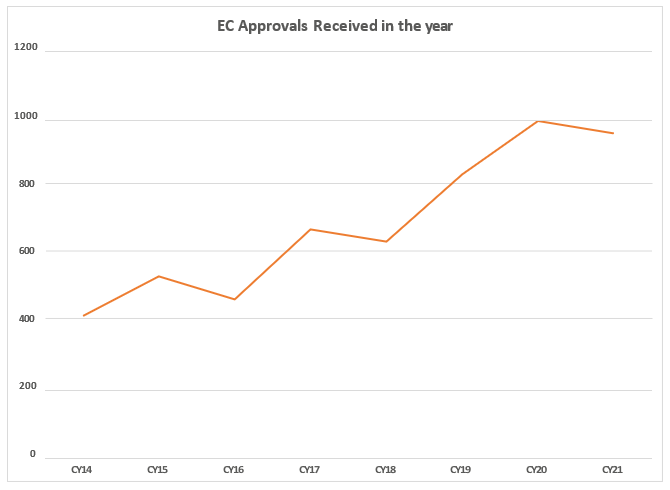
I would like to look at India from a supply and demand side positioning. For this purpose, let’s assume the supply side to be our ability to produce more and demand side to be the willingness of the customers to buy more. From a supply side perspective, I believe that the September 2019 corporate tax cut (30% to 22% for existing businesses and further cut to 15% for new manufacturing units) was a game changer for India. Add to that the PLI scheme incentives across a wide range of industries. These steps have significantly improved the competitiveness of India as a new manufacturing base. The sharp rise in the Environmental Clearance (EC) applications and approvals, which is a leading indicator of the upcoming capex cycle, might be the evidence of success of the policy.
According to me the other game changing event happened in 2016 when Reliance launched Jio. Internet access reached all the corners of India at the cheapest rates in the world affordable to all segments of the population. The real effect of this may be slow but will surely be seen on the productivity of the Indian employees. I have grown in a village and I know how little access I had to knowledge and quality education. There was a huge gap when compared to the Indian metros and especially to the developed world. Indian villages and towns are filled with many ambitious and talented entrepreneurs and employees. Due to the access to internet and the accelerated digitization forced by COVID, the gap in access to knowledge and self-learning tools have narrowed tremendously. Even if 10% of the population benefits from this, it will create a large and skilled pool of workforce to support the above capex.
The Demand Side
As you know, we at SageOne look for companies which create demand/growth for themselves by gaining market share from the competition or by entering new product categories. I believe India is fortunate to be in a similar position at a time when the supply side is improving in its favor. The trade war between US and China as well as the internal policy changes that China is undergoing has opened up a window of opportunity to capture market share away from them. This includes gaining market share in the existing industries that India is already in as well as getting into new industries.
Since 1980, China has attracted corporations by heavily subsidizing (land, electricity, financing etc.) the setting up of manufacturing base in their country. The low cost of manufacturing in China and a very supportive government forced closure of vast manufacturing industries across the world. Rapidly they have become the factory for the world. It’s similar to the Amazon model or models followed by many start-ups where in you disrupt existing businesses by funding customer acquisition through VC/PE funding. You suffer huge losses in the initial years, but as others go out of business, you become the dominant supplier. As competition reduces, you gain pricing power and more than make up for the funded losses.
With recent trade war and internal policy changes, the world is concerned and has started looking for diversification of suppliers. You can see multiple countries enforcing duties and restrictions on Chinese imports. In the meantime even China is looking to move up the value chain, focus on high value added products/industries and reduce subsidizing. Both these factors will relocate global supply chain thereby increasing prices. One can already see its effect on the global inflation. I believe this inflation will be sticky and if it’s kept in a manageable range, the world will adjust with higher corporate profitability and higher wages. Due to the factors discussed above, I believe Indian corporates and population will be big beneficiaries of this adjustment.
In addition to the above changes, India stands out in terms of:
→ Historically low corporate leverage thereby supporting capex without leveraging their balance sheet
→ Stable currency supported by record forex reserves. A stable currency instills confidence in foreign investors to invest in the country as well as reduces hedging cost and thereby foreign funding cost
→ Rare country with bond yields above the CPI rate which puts almost no pressure on the RBI to increase rates anytime in the future
→ Big and painful steps such as GST implementation and banking system cleanup already done. Benefits of these steps are already seen and will continue
→ Government finances relatively strong with tax collection expected to be well above budgeted and debt levels well under control
Having gone through a very tough past decade, Indian entrepreneurs have become very frugal and efficient. After many years they are presented with a huge opportunity, low funding cost, supportive policies and a strong balance sheet. I am extremely hopeful and positive that we will grab this opportunity given our positioning as discussed above. Any industry that would be beneficiary of inflation, can gain market share from China through its competitiveness and has the pricing power should do well. I would not want to miss the forest (India opportunity) for the trees (market timing).
Warm Regards,
Samit S. Vartak, CFA
Founder and Chief Investment Officer (CIO)
SageOne Investment Managers LLP
Email: ir@SageOneInvestments.com
Website: www.SageOneInvestments.com

*SageOne Investment Managers LLP is registered as a PMS and an AIF with SEBI.
Appendix
SageOne Core Portfolio (SCP) Performance (Net of Fees)
For the first three years, we managed proprietary funds and for the last 9 years and 9 months, we have been advising/managing funds for external clients. Since clients have joined at various stages, individual performance may differ slightly based on the timing of purchases. For uniformity and ease, we measured our IA performance using a “representative” portfolio (that resembles advice given to clients) and we call it SageOne Core Portfolio (SCP). SageOne core portfolio is not a dummy/theoretical portfolio but the CIO’s actual total equity portfolio. The representative portfolio until FY17 was reviewed by KPMG. Post that the performance is for the PMS scheme. Calculated on a TWRR basis for the entire period.
12 Years 9 Month Performance in INR (Apr 2009 – Dec 2021)
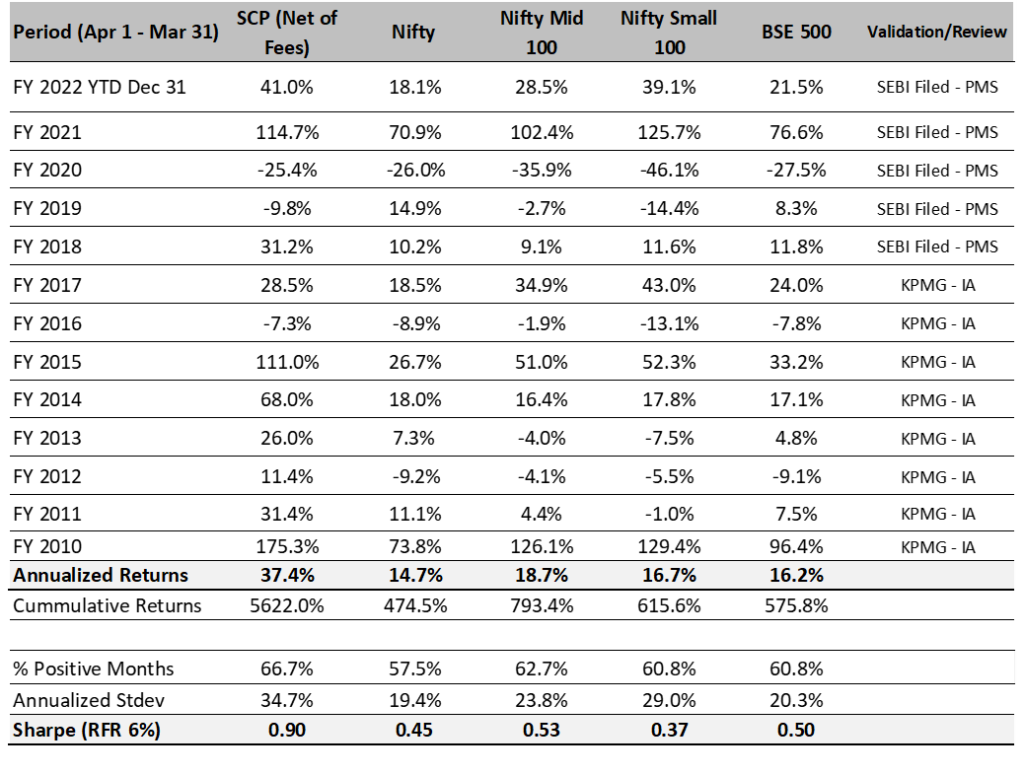
Source: SageOne Investment Managers, Bloomberg, Wealth Spectrum
* SCP consists of 17 stocks as of Dec 31, 2021. Average Mcap 26,800 cr
SSP Portfolio* Performance (Net of Fees)
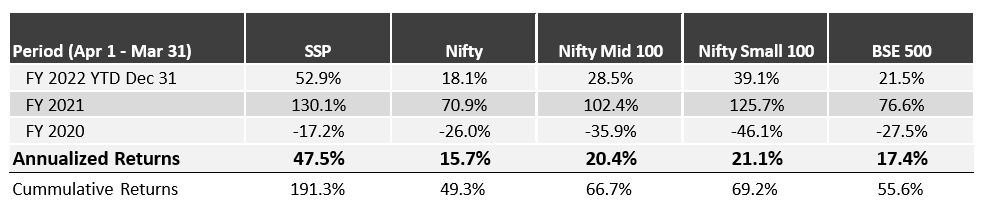
Source: SageOne Investment Managers, Bloomberg, Wealth Spectrum
* SSP (SageOne SmallCap Portfolio) portfolio is composed of 12-20 stocks with Mcap ranging from 500 cr to 5000 cr at entry. This scheme was launched last year. Average Map as of Dec 31, 2021 was 8,000 cr
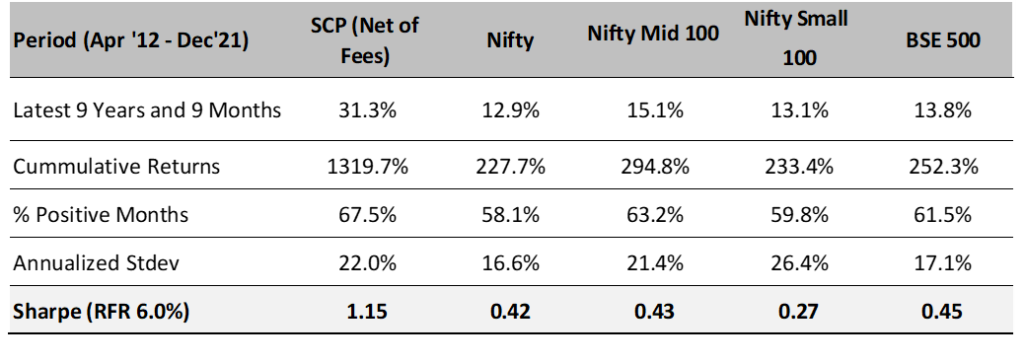
SCP: Latest 9 Years 9 Month Performance (Apr 2012 – Dec 2021)
SCP: First 3 Years Performance (Apr 2009 – Mar 2012)
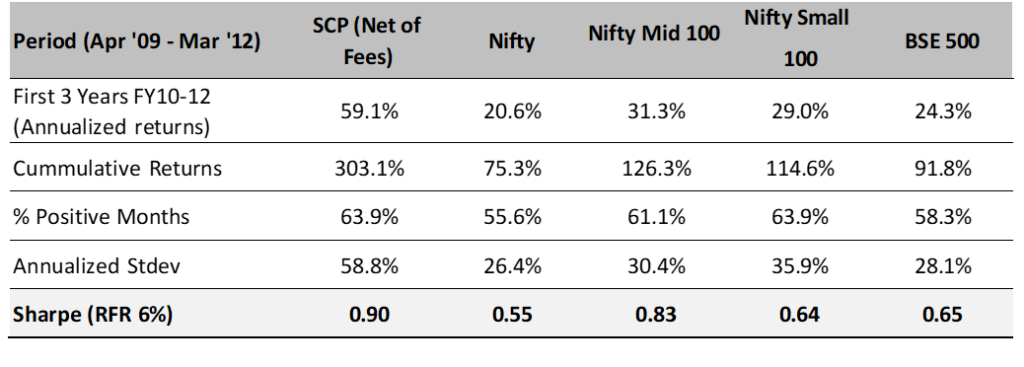
*We have consciously changed the composition of the core portfolio in terms of the average size of companies and the number of stocks in the portfolio after we started advising external clients in April 2012.
*The weighted average size of stocks at the start in FY10 was below $0.25 bn which has increased to more than $3.5 bn by the end of Dec ’21. Also, the number of stocks has increased from 5 (+/- 2) in 2009 to 15 (+/- 2) during the past 9 years and 9 month.
*Reasonable diversification was done by design to improve liquidity and reduce volatility as a result of which annualized standard deviation has come down from 59% for the first 3 years to 22% during the last 9 years and 9 month.
Legal Information and Disclosures
Any performance related information provided above is not verified by SEBI.
This note expresses the views of the author as of the date indicated and such views are subject to changes without notice. SageOne has no duty or obligation to update the information contained herein. Further, SageOne makes no representation, and it should not be assumed, that past performance is an indication of future results.
This note is for educational purposes only and should not be used for any other purpose. The information contained herein does not constitute and should not be construed as an offering of advisory services or financial products. Certain information contained herein concerning economic/corporate trends and performance is based on or derived from independent third-party sources. SageOne believes that the sources from which such information has been obtained are reliable; however, it cannot guarantee the accuracy of such information or the assumptions on which such information is based.