
April 2025
Greetings,
The Indian markets have experienced a significant correction since September 2024, driven by several factors, including an unexpected earnings slowdown across multiple quarters, valuation derating across various sectors, reduced government spending, and an uncertain global macroeconomic environment. The correction is also attributed to a high base effect stemming from robust earnings growth in the post-COVID period. Furthermore, the recent imposition of tariffs by Trump on several countries has added complexity to the market dynamics. As a result, numerous stocks, including those of quality businesses, have declined sharply, with some experiencing drops of 30-40% from their peak levels.
We may see high short-term volatility due to near-term uncertainties in domestic earnings growth and the global macro environment. However, given that valuations have moderated and India’s long-term structural growth story remains intact, we believe investors with a long-term investment horizon can leverage these fluctuations to their advantage.
How has been the performance of SLMP so far?
Earlier, many important events like rising geo political tensions, negative surprise in election results, increase in capital gains tax, etc. were ignored by the market with no drawdowns in 2024. However, the recent earnings disappointment, coupled with high valuations, and global uncertainty, has led to a large correction in the market.
The performance of SLMP has been resilient during this tough period, with a drawdown similar to broader indices, inspite of the earlier outperformance. A well-rounded process of stock selection and allocation have led to this performance.
Net Returns of SLMP vs Benchmarks (as of March 31st, 2025) *
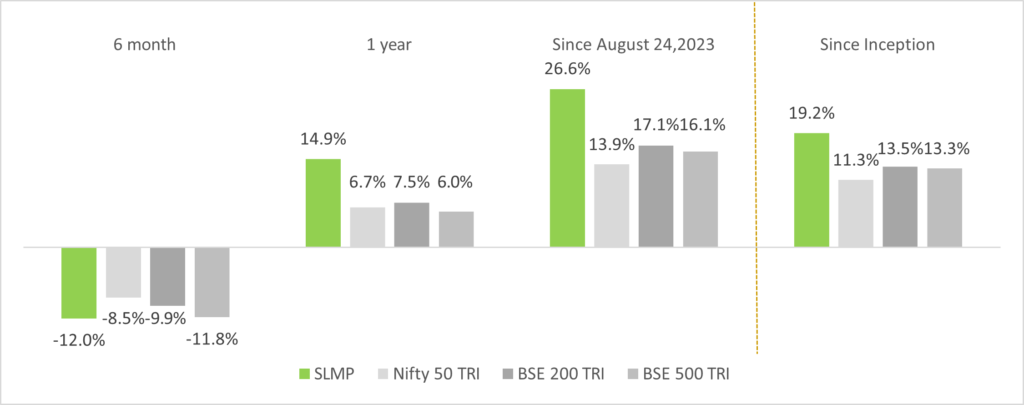
*Returns are net of costs and fees and a combination of managing proprietary funds from 1st April 2022 up to 24th August 2023, followed by managing client money. Returns greater than 12 months are annualized returns. BSE 200 TRI is assumed as BSE 200 returns plus dividend yield of 2.4% p.a.
Note: Returns of individual clients will differ from the above numbers based on the timing of their investments. Past performance is not an indication or promise of future performance. The performance related data has not been verified by SEBI.
How resilient has the SLMP portfolio been?
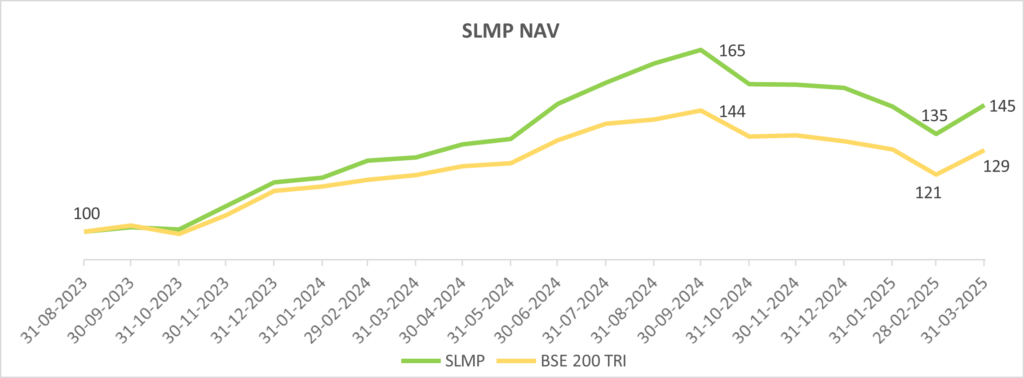
From the time we started managing client money and up to September 2024, SLMP outperformed the benchmarks – 65% returns for SLMP vs 44% for BSE 200 TRI – an Alpha of ~20%+. Inspite of a steep correction from September 2024, the portfolio has corrected in line with the benchmarks. The portfolio has witnessed a drawdown of 18% which is similar to broader indices (16% drawdown for BSE 200 TRI and 18% drawdown for BSE 500 TRI). Bulk of the drawdown was due to a fall in valuations of SLMP stocks with just ~6% accounted by earnings cuts (3% each in Q2FY25 and Q3FY25).
In our earlier memos and webinars, we had re-iterated that the robustness of our process would be put to test during a market correction. We are satisfied with the resiliency of the SLMP portfolio during this correction. Our endeavor still remains to keep improving our processes and learn during each market cycle.
Note: The performance related data has not been verified by SEBI.
Are indices masking the intensity of the correction?
Although indices have not seen significant drawdowns, it’s important to dig deeper to understand this fall.
→ Indices like Nifty or BSE 200 have only corrected 11%-13% from September 2024
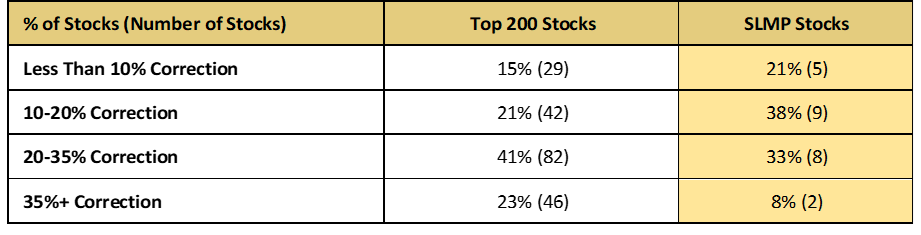
→Yet, 50% of the Top 200 stocks by Market Capitalization (as defined by AMFI) have fallen more than 25% from their peak. For SLMP, only 8 out of 24 stocks (33%) have fallen by more than 25%.
→ The median fall for the Top 200 companies is 25% while its 17% for SLMP
→ Only 36% of the Top 200 stocks have fallen less than 20%, but for SLMP this same number is 61%.
→ ~50 of Top 200 stocks have fallen by more than 35%, as compared to only 2 stocks for SLMP
Note: The performance related data has not been verified by SEBI.
What has led to the resiliency of the SLMP portfolio?
A) Portfolio Earnings Growth
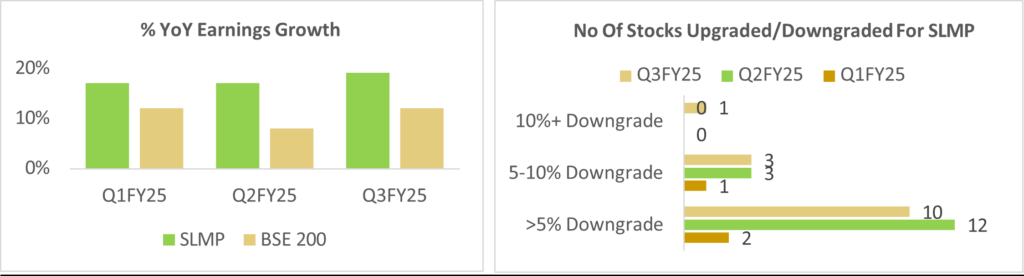
Inspite of the recent slowdown, SLMP portfolio continues to deliver 17-19% YoY earnings growth and in line with our long-term targeted earnings growth expectation of 16-18%. In the same period, the earnings growth of our fishing pond (Top 200 companies) was much slower at just 8-12% YoY. SLMP companies have not seen material earnings downgrades as only 3 companies witnessed a cumulative downgrade of more than 10% over the last 3 quarters.
B) Portfolio Composition
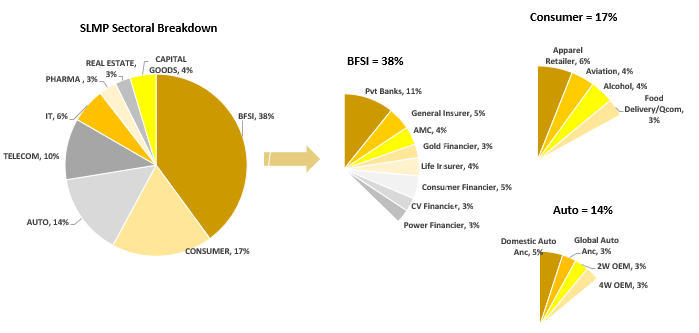
Our portfolio comprises of companies which have been resilient through multiple events over the years. We are bottoms up stock pickers and sectoral allocation is an outcome for us. With valuations being high for many sectors, we were able to identify & invest in ideas from the financial sector, resulting in a ~37% portfolio weight for this sector. During the drawdown, financial stocks have been most resilient with negligible earnings downgrades or valuation de-rating.
Although it appears that the portfolio is extremely concentrated with ~70% allocated to just 3 sectors, we are invested in multiple sub sectors within each sector, with businesses having different growth drivers and following different cycles. For example, although BFSI has a 37% portfolio weight, Banks are only 11% weight followed by 14% for different NBFCs linked to consumer durables, gold, power, auto, etc. and 13% from non- lending segments such as AMCs and insurance (multi-line general insurer and life insurer).
C) Portfolio Churn
Taking cognizance of high valuations for certain stocks, we had trimmed weight in some of them. For example, Trent’s weight of almost 9% at the peak, was as low as 4.5% recently. We also trimmed weight in other expensive names like Chola Finance, Persistent, etc. We increased weight in companies with more reasonable valuations such as Tata Comm, REC, HDFC Bank, Axis Bank, Bharti, etc. For the long-term strength of the portfolio, we exited stocks where we didn’t have much clarity on future earnings (JSW Steel) or where earnings growth was low (Coal, NTPC) and replaced them with more predictable and higher growth companies such as Bajaj Finance, Tube Investments, Max Financial and Hyundai. We have recently started adding weight to Trent again, as we expect strong earnings growth and feel the valuations are now reasonable*.

How do our portfolio returns compare on a relative basis?
As most other competitive offerings in the large cap space are Mutual Funds, we have compared our performance to the top Mutual Funds below:
Performance comparison of SLMP for period April 2022- March 2025 (i.e. proprietary + client funds)

Performance comparison of SLMP for period Aug 2023- March 2025 (i.e. client funds)

*Returns of Top 10 Large Cap and Top 10 Large and Midcap MF (by AUM) are median returns
**Best MF is Top Performing MF from the Top 10 Large Cap and Top 10 Large and Midcap MF (by AUM)
Note: 1) MF AUM range for the Top 10 MF is INR 5,000 Cr to INR 60,000 Cr for the above schemes
2) Data is as of 31st March 2025
3) The performance related data has not been verified by SEBI.
Why are earnings of larger companies less volatile?
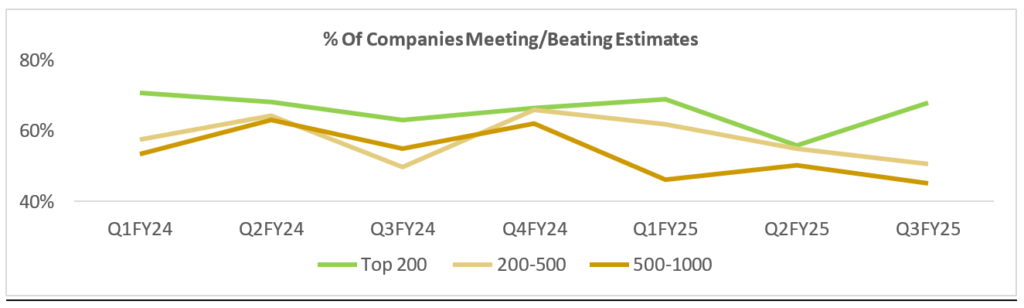
Large caps and larger midcaps tend to be mature companies with a lot of analyst coverage and data availability. There is also a long history of these businesses and their managements. Therefore, during difficult times, such as the last 3 quarters, these companies tend to be more resilient in terms of earnings growth. Based on analyst estimates, the chart below shows a large percentage of the Top 200 stocks by market cap are largely still beating/meeting estimates but the smaller companies have seen continued misses in earnings.
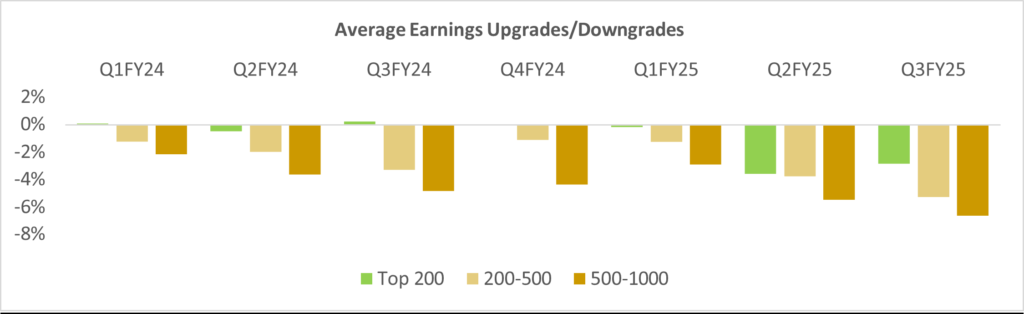
In terms of downgrades, Top 200 companies are witnessing minor downgrades over the last few quarters versus other smaller companies. This results in lower volatility of prices of larger companies. Having said that, we continue to believe that mid and small caps can generate higher alpha. For anyone with a preference for low volatility and stable returns, large caps should be preferred, as the earnings of large caps tend to be less volatile which is reflected in the stock price movements.
What are our recent learnings?
In our previous memo, we had shared that a major market correction could provide us with learnings on ‘error of commission’, as most of the prior learnings had been ‘errors of omission’. Our desire has been to always limit errors of commission. We are happy to share that we have so far not seen a major change to our thesis on any portfolio stock. Although a few stocks could be slightly lower than our purchase price, their long-term fundamentals and growth prospects, adds to our conviction of staying invested in them.
However, one key learning would be to be more proactive in management/churn in stocks from cyclical sectors (real estate, capital goods, power, global facing auto ancillaries) or for stocks with high valuations (discretionary consumption). Having now seen one cycle of a bull and bear market, we hope to incorporate learnings from the entire cycle to keep improving our processes.
What is the current outlook?
→ Although corporate earnings for the last 3 quarters have disappointed, our channel checks and discussions with corporates suggest the beginning of a sequential improvement at a broader level. We continue to remain positive on the long-term structural growth story of India. Strong corporate, government and bank balance sheets, along with resumption of government capex, cooling inflation and tax boost for consumption, all point to a stable domestic macro environment.
→ The global macro environment on the other hand is in a state of complete flux post the imposition of tariffs by the USA on many countries. As of today, its impossible to predict or conclude the outcome of this event. We will wait for things to settle down before we have a view on the same.
→ Our previous memo spoke about the possibility of drawdowns of 10-15% within periods of a bull mkt cycle. Having gone through this drawdown, we believe there is more comfort in valuations then there was 6 months ago.
→ A year back, expectations and valuations were both high but both have now moderated to a certain extent.
→ Going ahead, we believe the market breadth will shrink and only companies reporting strong earnings growth will outperform. Therefore, the market going forward should be a stock pickers market unlike the last 3 years.
→ We are currently expecting strong 18-20% earnings growth for SLMP over the next 2 years as against 12-14% CAGR for Nifty 50 and 15-17% CAGR for Top 200 stocks by market cap. We do expect the earnings estimates to get trimmed due to the current macro environment. Higher earnings growth and higher ROE along with lower P/E multiple of SLMP versus the Top 200 fishing pond will be a key margin of safety during this turbulent period.
Having come through the first testing phase for SLMP, we are quite happy with the robustness of the process. There is always room to improve and we continue to take cognizance of areas we can improve. We have gotten through the drawdown so far, with limited churn and with a drawdown in line with the benchmarks inspite of significantly outperforming prior to the fall. Samit’s guidance and the support of the team have been instrumental to help us deliver this performance.
We continue to aspire for a 16-18% CAGR from here as well, through our well crafted bottoms up investment approach, implying doubling the portfolio in 4.5-5 years post fees and expenses. The minimum ticket size for SLMP is INR 50 lacs and there is NO exit load. We have kept our fee structure extremely competitive vs other similar large cap funds. SLMP could be considered as an alternative or an option for any investor’s existing or new Large Cap equity allocation.
Thank you for always having faith in SageOne and we hope that we continue to deliver to our clients through this offering and look forward to your participation.
Warm Regards,
Satish Kothari & Kshitij Kaji
Fund Managers, SLMP
SageOne Investment Managers LLP
Legal Information and Disclosures
Any performance related information provided above is not verified by SEBI.
This note expresses the views of the author as of the date indicated and such views are subject to changes without notice. SageOne has no duty or obligation to update the information contained herein. Further, SageOne makes no representation, and it should not be assumed, that past performance is an indication of future results.
This note is for educational purposes only and should not be used for any other purpose. The information contained herein does not constitute and should not be construed as an offering of advisory services or financial products. Certain information contained herein concerning economic/corporate trends and performance is based on or derived from independent third-party sources. SageOne believes that the sources from which such information has been obtained are reliable; however, it cannot guarantee the accuracy of such information or the assumptions on which such information is based.