
Dear Investors,
Indian equity markets have struggled and significantly underperformed most global markets over the last 16 months, following a bull phase that began in March 2020. That phase was marked by shallow corrections and was driven by government-led capital expenditure. The subsequent underperformance has been driven by a mix of fundamental factors and sentiments.
On the fundamental side, momentum in capital expenditure weakened as infrastructure project execution slowed to around 35% below budget during April–November 2024, when government resources were absorbed by central and large state elections. This slowdown was followed by the India–Pakistan war and the unexpected imposition of 50% tariffs on India by the US, both of which significantly dented investor sentiments. As a result, foreign institutional investors (FIIs) exited with record net outflows of nearly USD 23 billion during CY2025 and January 2026.
Concurrently, and possibly aided by the RBI allowing the INR to weaken to support exporters amid US tariffs, the rupee depreciated by approximately 10% against the USD and 19% against the EUR over the last 18 months. Indian equity markets are highly correlated with the INR–USD trajectory (as outlined in my September 2020 memo), and this currency weakness added further downward pressure on equities.
The headline Nifty 50 index does not fully reflect the extent of pain experienced across the broader market over the last 16 months. The table below highlights the point-to-point decline from the previous peak.
Performance from the previous peak on September 27, 2024 to January 23, 2026

Source Data: Ace Equity using closing prices for both dates
Add to this the added pain due to biggest underperformance against the emerging markets in at least 3 decades during the below period when INDA (MSCI India ETF) underperformed the EEM (MSCI EM ETF) by 40.3% in USD terms.
Bull markets typically lead to excess leverage in the system, and this cycle was no exception. Margin Trading Facility (MTF) and Loans Against Shares (LAS) expanded aggressively during the upcycle. As markets continued to slide and global volatility increased across currencies, commodities, and precious metals, margin triggers were hit. Financing companies, seeking to manage rising risk, moved quickly to reduce their LAS exposure, leading to forced selling that accelerated the market decline in the last month. During January 1st to January 23rd while the Nifty 50 index fell 4%, the median fall in BSE MidSmall Index constituents was 10%. The buyers have gone missing and even small selling trigger exaggerated falls for absolutely no fundamental reasons.
High Probability of a Bottom
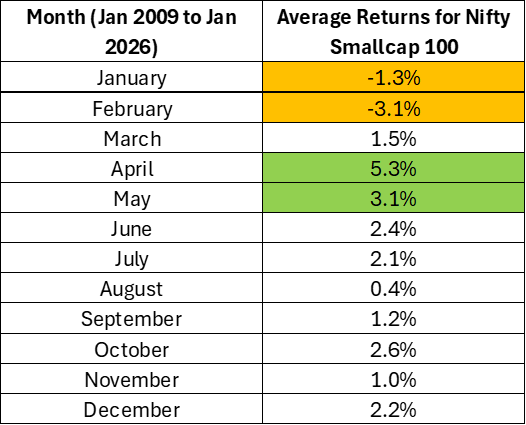
In my assessment, the ongoing market trends and behavior, reflect traits commonly observed near the bottom of the markets. It also coincides with a seasonally weak period for Indian equities, where majority of market bottoms have occurred. In this period, liquidity is typically drained ahead of advance tax payments (March 15) and banks / financing companies also reduce risk exposure before the fiscal year-end (March 31). The following table confirms that January–February have historically been the weakest months, while April–May tend to be the strongest as liquidity returns to the system. The Nifty Smallcap index has been used here, as it represents a broader market behavior.
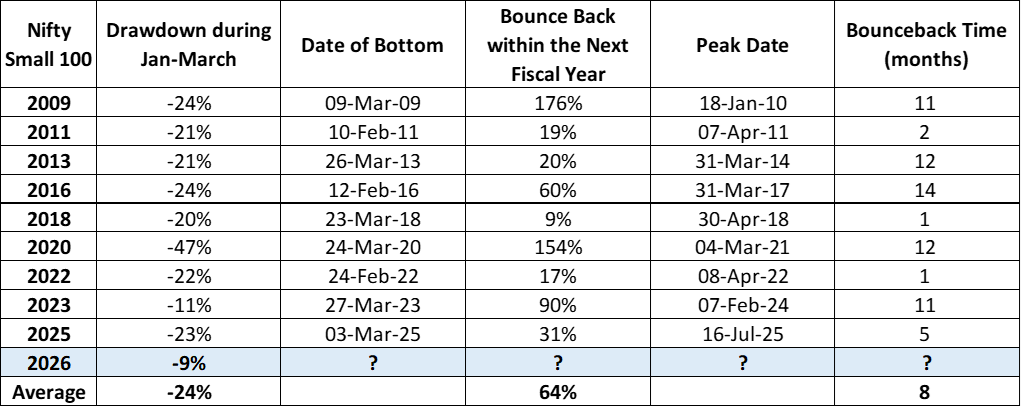
Surprising Success Rate of Market Bounce Back
Historically, majority of market bottoms have occurred during February-March. Drawdowns (drop in Nifty Small 100 from peak to bottom during Jan-Mar) of 20% or more occurred roughly every alternate year, and the subsequent recoveries have generally been sharp. I believe the current environment bears strong similarities to 2023 (only other back-to-back years, 2022 & 2023, when such drawdown occurred) and there is a strong probability of a sharp bounce back similar to previous instances listed in the below table. Note that since 2009, the Nifty Small 100 has bounced by 64% on average (9 instances) whenever there has been a sharp drawdown in the January-March quarter. In my subsequent sections, I outline fundamental support for a high probability of a sharp bounce back similar to past instances.
Strong Leading Indicators
Several underlying fundamentals have begun to improve. Government capital expenditure (capex) has rebounded to budgeted levels, with the current monthly run rate approximately 65% higher than during the slowdown I mentioned earlier. At the same time, consistent signs of a pickup in private sector capital expenditure are becoming visible. Below is the Capex for listed companies (mcap > 1000 cr) as a % of their net block which has shown continuous improvement.
Capex as a % of Net Block
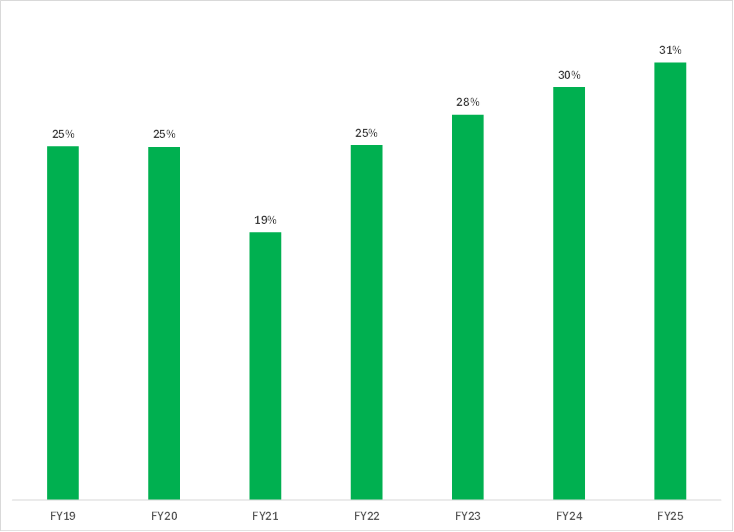
Source: Ace Equity
In addition, there is a sharp pickup observed in the private capex announcements as can be seen in the chart below.
Trailing Twelve Months (TTM) Capex Announcements (Rs. Bn)
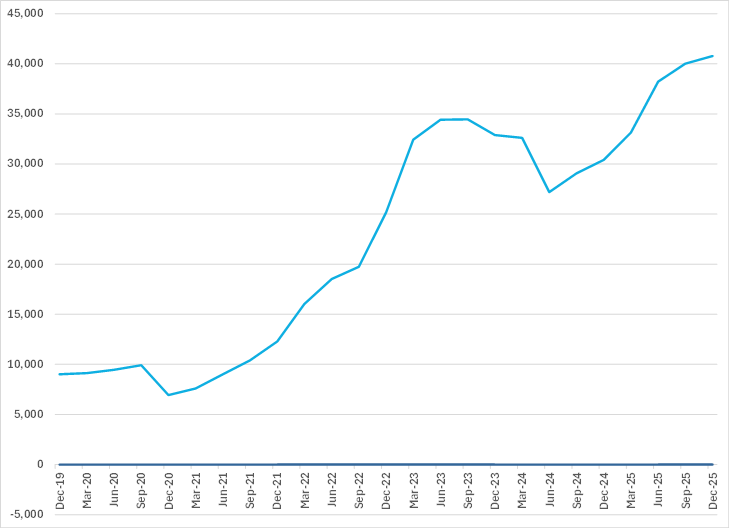
Source: CMIE
Beyond capex—which is a leading indicator—there is growing anecdotal evidence of a broad-based pickup in on-ground economic activity. Some examples:
- Commercial vehicles: In Q3 FY 2025-26 (Oct–Dec 2025), the commercial vehicle segment recorded its highest-ever quarterly sales, with 21.5% YoY growth. December growth was even stronger, indicating acceleration within the quarter.
- Industrial credit: Bank credit to industry grew at a faster pace of 13.3% YoY in December 2025, compared with 7.5% in the corresponding period last year.
- Steel pipes (fabrication): The largest structural steel pipes manufacturer reported its highest-ever volumes in Q3. Against a typical daily sales volume of 8,000–9,000 tonnes, sales during the last fortnight of December surged to 12,000–15,000 tonnes per day. This momentum has continued into January, prompting the company to sharply revise its forward guidance upward.
- Other building materials: Adjacent segments such as cables & wires and cement have also witnessed a sharp pickup in sales, reinforcing the breadth of the recovery.
- Corporate earnings: For Q3 results reported so far, mid-cap companies have delivered ~18% YoY net profit growth, while small-caps have delivered over 30%. This follows already strong growth of 18% and 15% YoY, respectively for mid and small cap companies, in Q2.
As a fund manager, I am privileged to get the opportunity to talk to many entrepreneurs and evaluate dozens of emerging companies every month. Over the last decade, I have seen such a drastic improvement in entrepreneur quality and the ambition they have of building great businesses. They are best in class across the world, and nothing makes me more positive on India and its equities than that.
Perspective on Valuations and Current Opportunity
Median valuations across the largest 1,000 listed companies have corrected by over 30% in the last 16 months, with the magnitude of the correction inversely proportional to company size. As a result, we are now finding genuinely high-growth businesses within our small and micro-cap universe trading at single-digit or low-teens FY27 P/E multiples. At our small & micro-cap portfolio level, the forward valuation has compressed to below 15x, placing it among the lowest levels of the past decade, while two-year net profit growth expectations remain robust at over 35%.
The combination of extreme negative sentiments, technical/forced selling, prolonged period of drawdown and underperformance has significantly skewed the risk-reward equation in favour of long-term investors investing in the Indian markets. This backdrop makes us constructive—particularly on the small-cap segment, where both valuation and earnings asymmetry are most compelling.
While further downside cannot be ruled out, we believe any additional correction is likely to be limited. That said, periods like these are emotionally taxing. Adding capital near market bottoms is inherently scary, and incremental declines at depressed levels can feel extraordinarily painful. This fear of the final 5-10% crash forces many investors to miss out on a much larger bounce back.
However, for a long-term investor, there is no alternative to enduring this volatility if one seeks to capture meaningful long-term wealth creation. Historically, the most attractive returns are generated precisely during such periods of discomfort, even though they are the hardest times to deploy capital.
Equity investment does not work on guarantee or certainty but works on probabilities. Current probabilities are heavily in favour of Indian equities especially small caps.
Warm Regards,
Samit S. Vartak, CFA
Founder and Chief Investment Officer (CIO)
SageOne Investment Managers LLP
Email:ir@SageOneInvestments.com
Website:www.SageOneInvestments.com
@SamitVartak
*SageOne Investment Managers LLP is registered as a PMS and an AIF with SEBI.
Appendix
SageOne Core Portfolio (SCP) Performance (Net of Fees)
For the first three years, we managed proprietary funds and for the last 13 years and 9 months we have been advising/managing funds for external clients.
16 Years and 9 Months Performance in INR (Apr 2009 – Dec 2025)
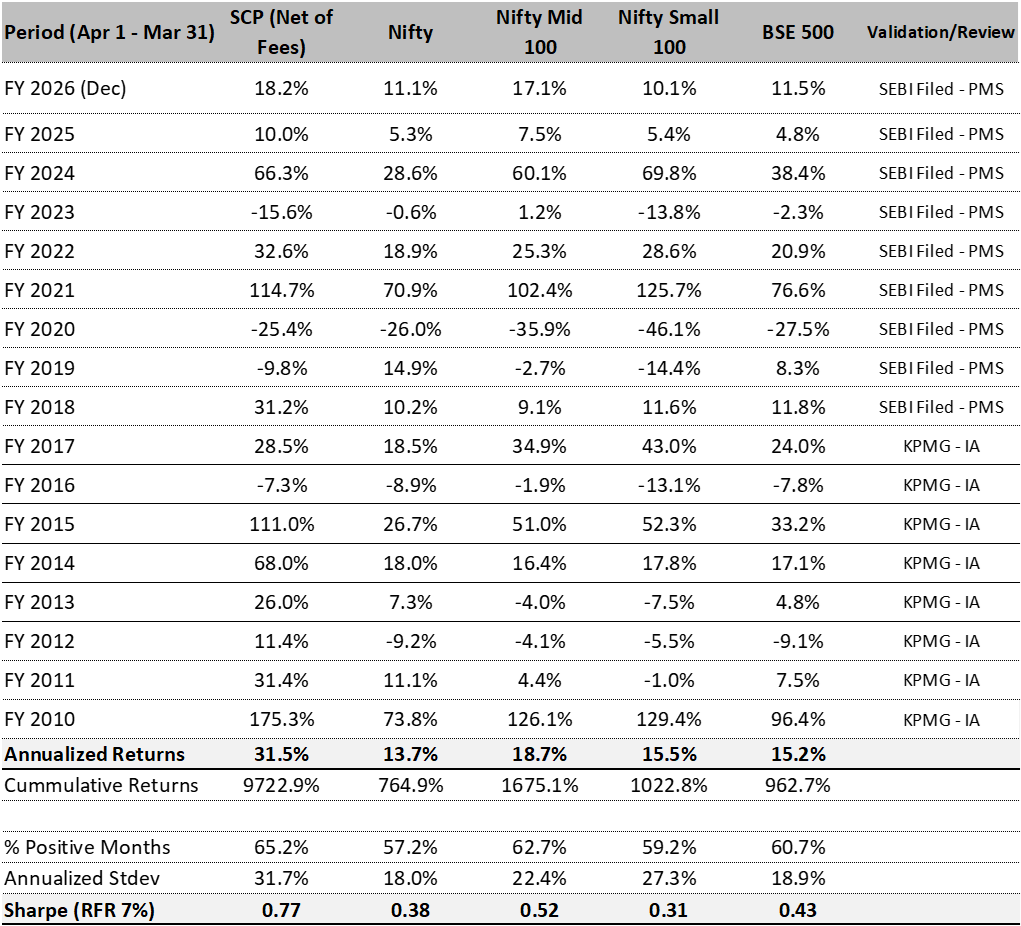
Source: SageOne Investment Managers, Bloomberg, Wealth Spectrum
Performance of SageOne India Growth Open Ended AIF 3 (Net of Fees)
as of Dec’25
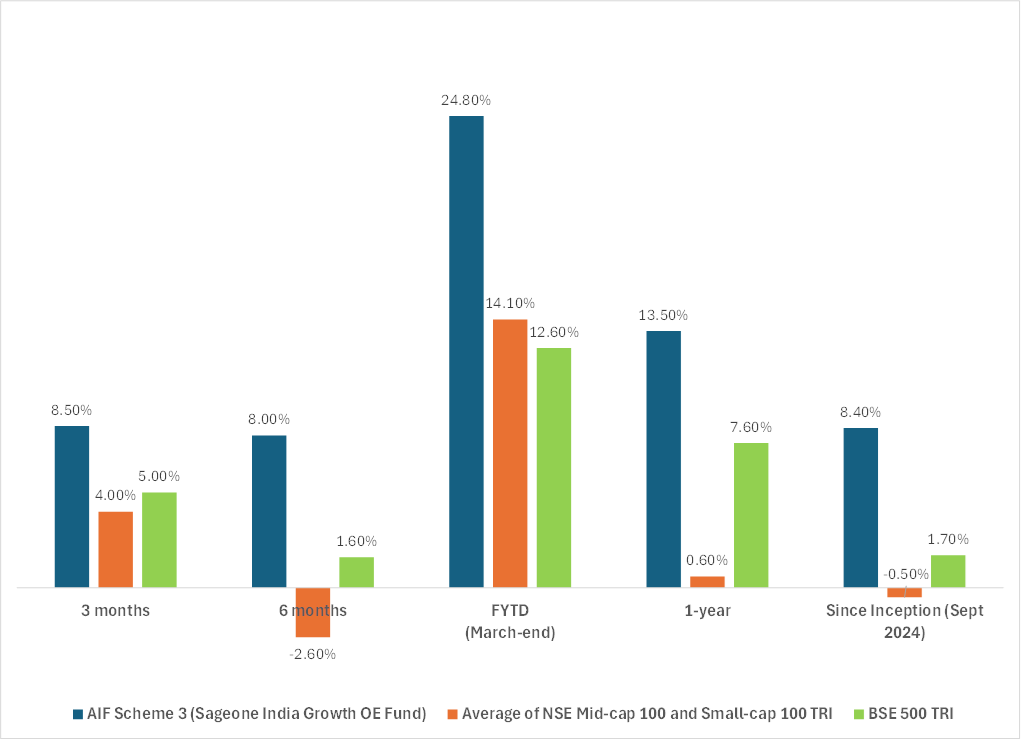
SageOne AIF Scheme 1 was fully redeemed between June’22 to Aug’22 and most investors reinvested the proceeds in Scheme 2. Scheme 2 is closed for new fund raise since Jan’23.
SSP* Portfolio Performance (Net of Fees)
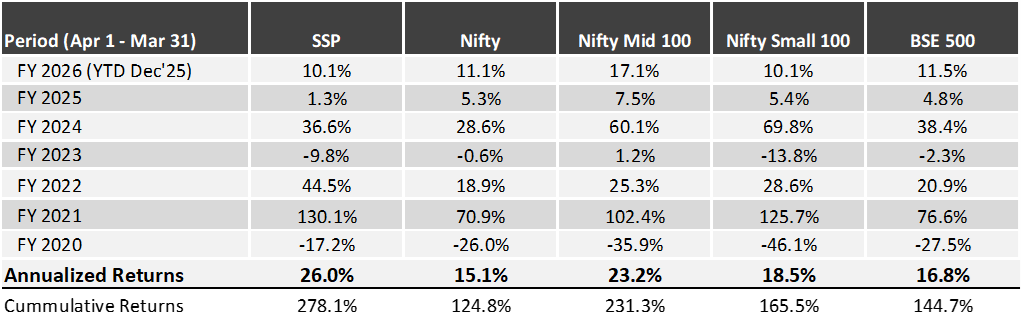
Source: SageOne Investment Managers, Bloomberg, Wealth Spectrum. *SSP is SageOne Small cap Portfolio
Legal Information and Disclosures
Any performance related information pThis newsletter expresses the views of the author as of the date indicated and such views are subject to changes without notice. SageOne has no duty or obligation to update the information contained herein. Further, SageOne makes no representation, and it should not be assumed, that past performance is an indication of future results.rovided above is not verified by SEBI.
This note expresses the views of the author as of the date indicated and such views are subject to changes without notice. SageOne has no duty or obligation to update the This newsletter is for educational purposes only and should not be used for any other purpose. The information contained herein does not constitute and should not be construed as an offering of advisory services or financial products. Certain information contained herein concerning economic/corporate trends and performance is based on or derived from independent third-party sources. SageOne believes that the sources from which such information has been obtained are reliable; however, it cannot guarantee the accuracy of such information or the assumptions on which such information is based.information contained herein. Further, SageOne makes no representation, and it should not be assumed, that past performance is an indication of future results.