
This memo marks four years since SLMP was conceptualized and proprietary capital deployed. Over this time, Indian markets have faced challenging cycles, providing a valuable test for our investment process and performance. Four years offers a fair period to assess results, and we are pleased with the strategy’s progress. We aim to keep learning from mistakes and enhancing our process to improve performance going forward.
This memo outlines our current market views, along with an assessment of our performance. While short-term underperformance is inevitable at times, we remain confident that our investment process of focusing on resilient businesses with superior earnings growth will enable outperformance over longer periods. Our strategy relies on analysing the operating metrics of companies driving its growth, reinforcing our confidence in each company’s long-term stability and competitive advantage, rather than reacting to temporary price changes. We’ve provided examples to show how we assess and monitor these company-level metrics. In addition, we explain how SLMP’s portfolio construction differs meaningfully from both the Nifty 50 and comparable mutual funds. We belief that select large-cap companies, inspite of their size can continue to deliver superior and sustained growth when supported by strong industry tailwinds and superior execution.
Market outlook
While we typically discuss our market outlook toward the end of our memos, we believe it is more appropriate to address it upfront given the current environment.
-
Positives – Reasonable valuations with stable domestic earnings outlook
The Nifty 50 is currently ~12% below its September 2024 peak, reflecting an extended phase of subdued market performance lasting over 18 months. Over the same timeframe, earnings have grown by low double digits, implying that the market has undergone an approximate 25% valuation (P/E) de-rating over these 18 months. As we had highlighted in our earlier memos, valuations were elevated, and this correction has helped bring them to more reasonable levels despite continued earnings growth. While the indices appear relatively resilient, broader markets have been significantly weaker, with many stocks declining 30–50% from their highs over the past 18 months.
From a forward-looking perspective, more reasonable valuations indicate that a degree of risk has already been priced in, reducing the potential impact of incremental negatives. In a stable growth environment, lower valuations combined with strong balance sheets across the government, banking system, and corporates create a constructive backdrop for equities. Earnings growth has also shown signs of improvement from FY25 into FY26, with fewer downgrades. While FY27 expectations were stronger prior to the recent geopolitical tensions, and there may be some near-term impact on earnings, we do not expect any meaningful impact on the long-term fundamentals of businesses.
-
Negatives – Continuing uncertainties related to Tariffs, Artificial Intelligence (AI) and Wars
In the context of tariffs, India’s economy remains relatively diversified. Exports to the U.S. account for ~20% of total exports, translating to ~5% of GDP when services are included—limiting the overall macro impact. Since tariffs are ultimately the outcome of bilateral negotiations, and the final terms appear reasonably favorable for India, the associated risk from tariffs is likely modest or on the backburner now.
On the AI front, we have already seen the Nifty IT index falling ~30% in little over a month in anticipation of AI having a big impact on Indian IT service companies. We do believe that the AI risk is priced in to some extent and that Indian IT players will still have a role to play in the AI world. The larger uncertainty for us is how will AI affect jobs and unemployment at a country level which is still uncertain. However, AI adoption will happen gradually and there have been multiple tech cycles in the past which have not led to large scale unemployment as first feared during those cycles. Humans tend to upskill and adapt.
Over the past few years, global markets have navigated multiple geopolitical conflicts, including Russia–Ukraine and Iran–Israel, with limited long-term disruption to global supply chains as these conflicts remained relatively contained. The current situation in the Middle East, however, carries a higher degree of complexity, with the involvement of multiple countries. This is particularly relevant for India, given that a significant portion of its crude oil and gas imports originate from this region. Any disruption—especially in critical routes such as the Strait of Hormuz—could have broader implications for supply chains across industries. As a result, a swift and measured resolution is increasingly important to avoid escalation. While the possibility of a severe tail-risk event cannot be ruled out, the wide-ranging global economic implications of prolonged instability in the region increase the likelihood of a pragmatic outcome.
While these 3 negatives may not necessarily turn out to be bad in the long term, the uncertainty created by them today has definitely spooked the market. We do believe that the noise around these events is definitely much more than the actual eventual long-term impact. We do believe that these events, although bad as they increase the uncertainty, have been priced in to some extent.
What should an investor do in such a scenario?
Markets have repeatedly declined during financial or geopolitical crises, yet over time have recovered, reinforcing equities as one of the strongest long-term performers in an investor’s portfolio. Typically, market corrections compress valuations; and if long-term earnings growth is intact, this reduction in valuations effectively lowers risk. From a discounted cash flow (DCF) perspective, a company’s terminal value contributes far more to intrinsic value than the cash flows of any single year. As a result, even a temporary disruption to near-term cash flows—such as from a macro shock—can trigger sharp price declines despite minimal impact on long-term intrinsic value, thereby enhancing the attractiveness of equities.
We believe the positive drivers outlined above are largely structural and long term, while the negatives are more cyclical and short term. After more than 18 months of muted returns and elevated investor caution, the current environment presents a compelling entry point for those with patience and holding power. While further escalation of geopolitical risks could lead to additional near-term pain, the outlook on markets is definitely much more constructive today, than it was 18 months ago. While we aren’t geopolitical experts, financial markets typically discount risk far ahead of a conflict’s resolution. Consequently, part of the current uncertainty appears to be already priced into valuations.
SLMP performance
It has now been nearly four years since we began managing proprietary capital and about two and a half years since we started managing client funds. From the outset, we have maintained that performance should be evaluated over longer periods, particularly through difficult market environments rather than favorable ones.
Our objective has always been to generate 3–5% alpha over the Nifty on a post-fees basis over a 4–5-year period. Thus far, the strategy has surpassed this goal, generating approximately ~8% alpha over the Nifty 50 TRI since 6we began managing client capital, after fees. Across the broader four-year period that includes both proprietary and client capital, SLMP has compounded at ~17% annualized post fees. Despite a difficult environment for the majority of stocks, the strategy has continued to deliver strong long-term compounding for our investors.
The past year has been the only period where performance was broadly in line with the Nifty, and we have discussed the reasons for the same in the latter half of this memo.
Net Returns of SLMP vs Benchmarks (as of February 28, 2026) *
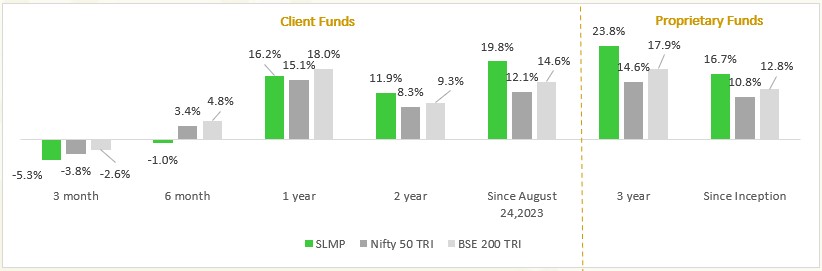
*Returns are net of costs and fees and a combination of managing proprietary funds from 1st April 2022 up to 24th August 2023, followed by managing client money. Returns greater than 12 months are annualized returns. BSE 200 TRI is assumed as BSE 200 returns plus dividend yield of 2.4% p.a.
Note: Returns of individual clients will differ from the above numbers based on the timing of their investments. Past performance is not an indication or promise of future performance. The performance related data has not been verified by SEBI.
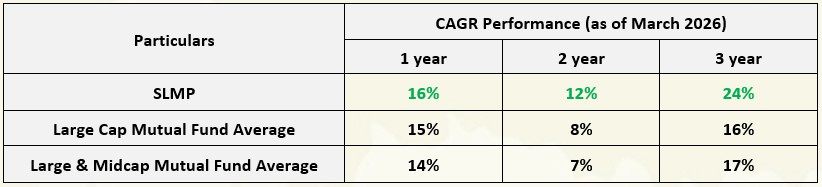
On a relative basis, SLMP’s performance has remained strong as well. Over a two and three-year period, SLMP has outperformed the majority of funds in both the large-cap and large & mid-cap mutual fund categories. The past year has been the only period where SLMP has not generated the typical 5–6% alpha relative to mutual funds. However, even during this phase, SLMP’s performance has remained above the average returns generated by funds in these categories.
Valuation reset impacted near term performance; but materially improved the long-term risk-reward
Over the past year, SLMP returns could have been better in our view. The SLMP portfolio is constructed with a deliberate tilt toward growth, with 70-80% allocated to growth businesses and the remainder to value opportunities. During the market correction over the past 12–18 months, several growth stocks have seen meaningful P/E compression despite continuing to deliver strong earnings growth.
This de-rating has occurred for a variety of reasons—ranging from short-term underperformance versus elevated expectations; to broader concerns such as potential disruption from AI or geopolitical uncertainties. To illustrate this dynamic, two examples from our portfolio are Trent and Persistent Systems.
Trent’s Trailing Twelve Month (TTM) P/E ratio has declined from roughly 110x to about 65x despite delivering ~17–18% earnings growth, which remains strong versus peers. While Trent may have faced some temporary operational challenges over the past year, the magnitude of the valuation compression has been significant relative to the underlying earnings trajectory. Similarly, Persistent Systems delivered approximately 38% PAT growth last year, yet the stock remains under pressure due to concerns around the potential impact of AI on the IT services industry.
The table below breaks down this de-rating in detail, showing how much of the stock movement is attributable to earnings growth versus the compression in valuation multiples. In both cases, the key takeaway is that earnings have continued to compound while valuation multiples have adjusted sharply.
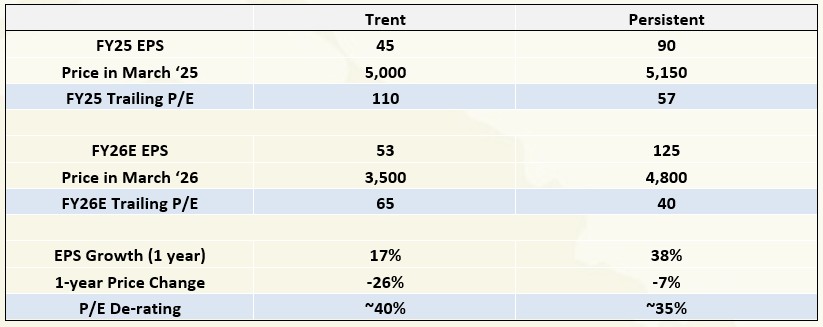
With valuations already having corrected meaningfully and earnings growth continuing, we believe the downside from current levels is increasingly limited. At the same time, there is meaningful upside potential if market concerns begin to ease. For example, if Trent sustains 18-20% earnings growth or if the market gains greater clarity that Persistent can benefit from – rather than be disrupted by AI – both businesses could see a combination of earnings growth and multiple re-rating from current levels. However, should operating metrics begin to lag relative to our expectations, we would reassess our thesis.
We have consistently chosen to take on valuation risk over business risk. While this has weighed on performance in the short term, it positions us well for the medium term, as we own high-quality businesses with strong fundamentals that can absorb macro shocks and are likely to see a re-rating as conditions normalize.
Portfolio earnings growth and consensus EPS changes are proof of the pudding
Our primary focus continues to be the underlying earnings growth of the companies we own, and on this metric the portfolio remains strong. Importantly, the earnings growth of our portfolio companies continues to exceed that of our fishing pond — the top 200 listed companies — and this trend has remained consistent across multiple quarters. For the first nine months of the year, portfolio earnings growth has remained in excess of 20% year-on-year.
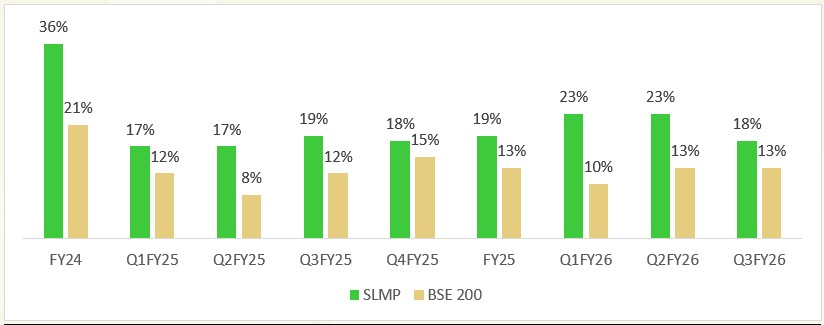
At the same time, earnings revisions for our companies have been relatively resilient. Aggregate earnings cuts for the portfolio in 9MFY26 have been minimal. Overall, this indicates that the earnings trajectory of the portfolio remains robust, with only a small number of companies seeing disappointments.
| Earnings Changes | Q1FY25 | Q2FY25 | Q3FY25 | Q4FY25 | Q1FY26 | Q2FY26 | Q3FY26 |
| SLMP | 2.8% | -3.1% | -3.2% | -1.8% | -0.4% | 1.0% | -0.4% |
| Top 200 | -0.2% | -3.3% | -2.6% | -2.4% | -1.4% | -0.4% | -1.2% |
Where we have identified structural concerns or weakening earnings visibility, we have taken decisive portfolio actions—exiting such businesses and reallocating capital toward companies we believe are better positioned to deliver sustained earnings growth.
While some companies may disappoint in a given quarter due to softer reported earnings or macro-driven price corrections, our focus remains firmly on long-term operating metrics. We believe that if these fundamentals remain intact alongside consistent earnings growth, stock performance should follow over the medium to long term. The next section of the memo discusses what we track in operating metrics through examples.
Focus on long-term operating metrics gives us more comfort in a falling stock price environment
Operating metrics are the underlying drivers of a company’s financial performance and, ultimately, its stock returns. At times, reported numbers may appear weak and lead to near-term underperformance, even as underlying trends remain strong—setting the stage for improved financial outcomes ahead.
For instance, a company may report lower margins due to heavy investments in a new vertical, which can drive significantly higher profits over time. Similarly, during a macro shock affecting an entire sector, underlying indicators may reveal how certain companies are positioned to emerge stronger and gain disproportionately versus peers. While such businesses may see near-term stock underperformance, their long-term outlook often improves, supported by a stronger and more durable competitive moat.
Some key operating metrics we track include market share gains (and the quality of those gains), execution nuances, and discipline in capital allocation. These factors provide deeper insight into a company’s true trajectory beyond what headline financials may suggest.
When a company demonstrates superior operating performance over long periods—whether through market share gains, stronger growth, or better execution—it often justifies a higher P/E multiple relative to the sector. As long as these operating metrics continue to hold, the higher valuation tends to sustain, while earnings continue to grow. Over time, this combination of sustained earnings growth and stable valuation can lead to predictable and steady stock price compounding, even during macro shocks.
In an ideal world, we would like to find companies with all these characteristics while also trading at low P/E multiples. However, in large-cap markets where companies are well researched and widely followed, it is rare to find businesses that simultaneously have superior operating metrics and low valuations. As a result, our differentiation lies in focusing deeply on long-term operating parameters that allow certain companies to consistently outperform their industries. The following three examples are included for illustrative purposes only and may represent current or past portfolio holdings. This information does not constitute a recommendation to buy or sell any security.
Examples
The first example is TVS Motor. Over the past two decades, the company has maintained a stable market share, with meaningful gains over the last three years. This improvement has come alongside continued investments in emerging segments such as electric vehicles and premium motorcycles, even as margins have steadily expanded. Peers like Bajaj Auto operate at margins of around 20%, suggesting further headroom for TVS Motor if it were to moderate investments. However, we favor its current strategy of balancing growth, market share gains, and margin expansion. Strong execution and customer focus have enabled it to sustain premium valuations and remain a top performer in the two-wheeler space.
Over the past three years, the company has delivered a revenue CAGR of ~20% and a PAT CAGR of ~33%. It stands out for its ability to capture evolving consumer preferences, build new categories, and scale brands while maintaining profitability—expanding its addressable market without compromising on growth or returns.
| TVS Motors | FY23 | 9MFY26 |
| Market Share (Domestic 2W) | 16% | 19% |
| EBITDA Margins | 12.5% | 15% |
The second example is Persistent. As the table shows, over the past five years—and even in FY26 so far—the company has grown materially faster than its mid-cap peers and nearly four times the pace of large-cap IT companies.
A key differentiator is its strong positioning in product engineering, which contributes roughly 60% of revenues, compared to only 5–20% for most mid-cap peers. This positioning makes the company particularly well placed to benefit from emerging areas such as AI. However, concerns around AI disruption have temporarily weighed on the sector and led to multiple compression, even as the company’s underlying growth remains strong.
| Organic Dollar Revenue Growth | FY19 | FY20 | FY21 | FY22 | FY23 | FY24 | FY25 | FY19-25 CAGR | FY22-25 CAGR |
| Mphasis | 13% | 10% | 5% | 19% | 7% | -10% | 2% | 5% | 1% |
| Hexaware | 12% | 10% | 1% | 15% | 20% | 8% | 13% | 11% | 13% |
| Coforge | 16% | 5% | 5% | 24% | 16% | 12% | 14% | 12% | 14% |
| Persistent | 2% | 3% | 12% | 33% | 28% | 14% | 18% | 18% | 20% |
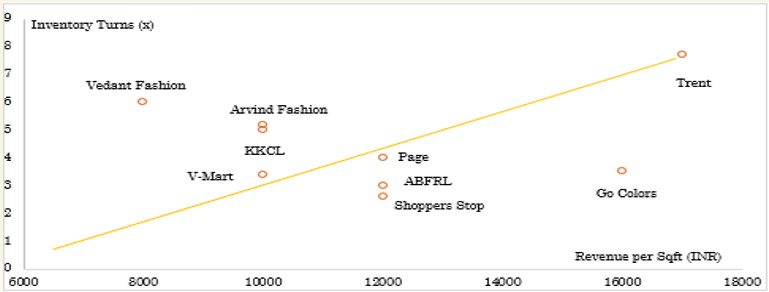
The third example is Trent. Apparel and fashion retail is a structurally challenging business, characterized by thin margins and rapidly evolving trends, often forcing companies to tradeoff between growth and profitability. In India, few brands have scaled beyond INR 2,000 Cr in revenue, and even those that do typically see a sharp slowdown in growth thereafter. Trent stands out as a rare exception. Despite a revenue base of ~INR 20,000 Cr, it continues to grow at ~18%, driven by just two brands—Westside and Zudio—and largely through its own stores, with minimal reliance on third-party channels. Its annual incremental revenue of ~INR 2,500 Cr is comparable to the total revenue of many standalone brands in India.
The company combines strong profitability with one of the fastest inventory turns in the sector, reducing the risk of excess stock and heavy discounting. Notably, despite recent flat-to-negative same-store sales growth (SSG)—which typically pressures margins in retail and has been a big topic of discussion recently —Trent has continued to expand margins, underscoring the strength of its operating model. Additionally, its scale enables larger minimum order quantities with vendors, fostering deeper supplier relationships and better margin control. Overall, Trent benefits from multiple structural advantages and operates within a large, underpenetrated market, positioning it well for sustained growth.
SLMP very different to owning a Nifty 50 ETF or Large Cap Mutual Funds
We believe investing in SLMP is fundamentally different from simply owning a Nifty ETF. While both are largely exposed to large-cap companies, the underlying portfolio construction is meaningfully different. This differentiated construct is intentional and is a key driver of our ability to generate alpha relative to the Nifty over the long term.
A large portion of the Nifty is concentrated in relatively lower-growth sectors. Approximately 56% of the index weight is in sectors such as BFSI lending, IT services, metals, and oil & gas. In contrast, SLMP has only about 19% exposure to these sectors, with the majority of that being in BFSI lending. This positioning reflects both our view on long-term growth and our core areas of competence.
Many of these sectors tend to be cyclical or offer limited visibility on sustained earnings growth, and therefore are not areas where we seek significant exposure. Instead, the portfolio is tilted toward sectors and businesses with stronger and more durable growth characteristics. As a result, the portfolio naturally trades at a different—and often higher—P/E multiple than the Nifty, reflecting its greater exposure to faster-growing companies.
|
SECTORS |
SLMP PORTFOLIO |
NIFTY 50 |
|
BFSI – LENDING |
16% |
35% |
|
BFSI – NON-LENDING |
15% |
2% |
|
FMCG, TELECOM |
4% |
14% |
|
DISCRETIONARY CONSUMPTION |
18% |
7% |
|
AUTO |
15% |
7% |
|
IT |
3% |
9% |
|
PHARMA & HEALTHCARE |
9% |
4% |
|
REAL ESTATE, INFRA, CAP GOODS & BUILDING MATERIAL |
18% |
10% |
|
METALS, O&G, POWER |
0% |
11% |
It is also important to evaluate our performance in the context of competing investment products. In our view, the most relevant comparable for SLMP are large-cap mutual funds and large & mid-cap mutual funds, as these categories broadly compete for the same investor capital.
Most of the large mutual funds in this category tend to closely mirror the benchmark, with modest overweight or underweight positions based on the fund manager’s views. As a result, index heavyweights typically feature prominently across these portfolios.
In contrast, SLMP follows a concentrated, bottom-up approach with a portfolio of 20–25 stocks and no linkage to any index. Stock selection and allocation are driven purely by merit—based on our conviction in underlying operating metrics, earnings growth potential, and valuations.
Myth that large cap companies can’t grow
One topic we frequently get asked about is the potential for high growth among large-cap companies. The general perception is that very few large caps can deliver strong growth due to their size, and that any reported PAT growth is often driven by one-off margin expansions or balance sheet deleveraging. In contrast, our focus is on companies that can consistently grow revenues, ideally through volume-driven, structural growth with minimal exposure to shallow cyclical swings.
Many of the largest US companies are growing at impressive rates today inspite of their size. Tech giants like Alphabet, Microsoft, and Meta are growing revenues at 11–17% CAGR on bases of $100–250 billion, while companies such as Nvidia, Micron, and Palantir are growing 30–50% CAGR. This shows that when industry tailwinds and company positioning align, even very large companies can sustain high growth.
Within SLMP, we see the same trend. Analyzing ten representative stocks from different sectors over the last 3 years, we observe revenue CAGRs averaging around 18% on bases of ₹4,000–80,000 crore. Bharti, a megacap with revenues of ₹1.4 lakh crore, has delivered 15% CAGR over the same period. Our objective is to continue identifying such companies at reasonable valuations, where growth is predictable, durable, and achieved without compromising margins or balance sheet strength.
|
SLMP Stocks |
Sector |
Market Cap (INR Cr) |
Revenue (INR Cr) – FY23 |
Revenue (INR Cr) – TTM |
3 Yr Revenue CAGR |
|
Eternal |
Platform |
2,30,000 |
7,000 |
42,000 |
80% |
|
Trent |
Retail |
1,20,000 |
8,200 |
19,000 |
33% |
|
Polycab |
Building Material |
1,05,000 |
14,100 |
27,000 |
25% |
|
Max health |
Pharma |
95,000 |
4,500 |
8,100 |
22% |
|
ICICI Pru AMC |
Financial Services |
1,40,000 |
2,800 |
5,200 |
22% |
|
Persistent |
IT |
77,000 |
8,300 |
14,000 |
20% |
|
TVS |
2-Wheeler |
1,63,000 |
32,000 |
53,000 |
18% |
|
Cummins |
Capital Goods |
1,30,000 |
7,800 |
11,600 |
15% |
|
Sam. Motherson |
Auto Ancillary |
1,15,000 |
78,000 |
1,21,000 |
15% |
|
Bharti |
Telecom |
11,20,000 |
1,39,000 |
2,03,000 |
15% |
Conclusion
Periods of heightened fear combined with sharp market corrections have historically created compelling opportunities for long-term investors in Indian equities, and the current phase appears no different. As discussed earlier, the 18+ months of time and price correction have led to more reasonable valuations, implying lower risk. While near-term disruptions—particularly from potential escalation in geopolitical tensions and oil-related supply shocks—could impact markets over the next quarter or two, these are largely cyclical in nature.
For investors with patience and a long-term horizon, this environment offers an attractive opportunity to increase equity exposure. We remain constructive on the market and would advocate using volatility to one’s advantage—either by being more aggressive during sharp corrections or by consistently adding on dips. While we aren’t geopolitical experts, financial markets typically discount risk far ahead of a conflict’s resolution. Consequently, part of the current uncertainty appears to be already priced into valuations.
Our preference has been to take valuation risk over business risk. While this approach has weighed on performance in the recent past, it has enabled us to build a portfolio of structurally strong businesses with healthy earnings growth, now available at more attractive valuations. We remain committed to a disciplined, process-driven approach, which we believe is critical for generating long-term alpha. Our performance over the past four years provides confidence in the robustness of this framework.
We continue to closely monitor key operating metrics to ensure that the fundamental drivers of outperformance remain intact. As long as these indicators reflect strong execution and industry leadership, we are comfortable maintaining—or even increasing—exposure to such businesses despite short-term valuation volatility.
We continue to aspire for 16–18% annualized returns over a 4–5-year horizon (post fees) and believe this remains achievable. We are confident in the robustness of our investment process, encouraged by the outcomes it has delivered so far, and committed to learning continuously from both successes and missteps.
Thank you for always having faith in SageOne and we hope that we continue to deliver to our clients through this offering and look forward to your participation.
Warm Regards,
Satish Kothari & Kshitij Kaji
Fund Managers, SLMP
SageOne Investment Managers LLP
Legal Information and Disclosures
This note expresses the views of the author as of the date indicated and such views are subject to changes without notice. SageOne has no duty or obligation to update the information contained herein. Further, SageOne makes no representation, and it should not be assumed, that past performance is an indication of future results.
This note is for educational purposes only and should not be used for any other purpose. The information contained herein does not constitute and should not be construed as an offering of advisory services or financial products. Certain information contained herein concerning economic/corporate trends and performance is based on or derived from independent third-party sources. SageOne believes that the sources from which such information has been obtained are reliable; however, it cannot guarantee the accuracy of such information or the assumptions on which such information is based.