



Dear Investors,
Our previous Knowledge Series notes have been an effort to distil our learnings across financial concepts, investment processes, and industry perspectives. In this note, we attempt to share our macro view on India—both as an economy and as an equity market—and assess the structural forces that could shape its trajectory over the coming years.
Equity markets are good indicators of the health of an economy over the longer term. To maximize their returns, investors are always looking ahead to understand how the economy (or economics of a business) is going to look few years out. For India specifically, it is always compared to a country like China to see potential of a business category or to US to show the level of under-penetration. Both countries have done phenomenally well over the last 3 decades, but equity markets give a contrasting view.
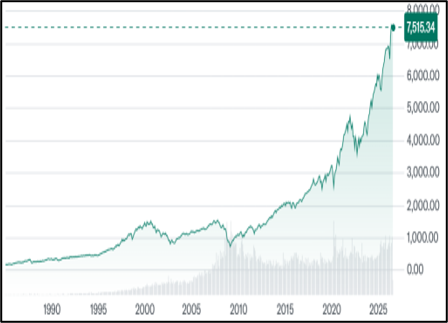
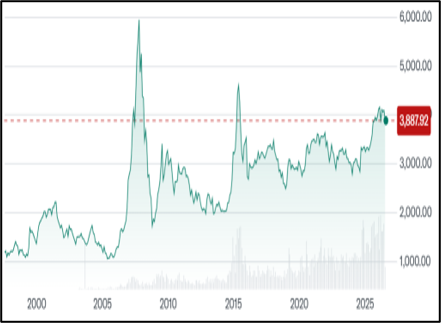
(Source: Investing.com)
So how is India positioned and which way is it headed?
To assess the same, we need to understand where India stands as of today. Let’s start with key natural strengths that India possesses –
- Demography + English Speaking Population
India has a median age of 28-29 with 65% of population under the age of 35. Most major economies are already past their peak, which means as every year passes, the proportion of non-working older population increases while its working population, which bears the brunt, sees its proportion shrinking. India is expected to hit its peak by 2041 – a 15-year window. At the same time, it has amongst the highest English-speaking population in the world with 100mn English speakers. This base is the foundation of India’s $300bn IT services exports which has almost tripled in the last decade.
- Geographic Advantage
India has a 7500km coastline and sits at the heart of major trade routes. 80% of global seaborne oil and 50% of containerized traffic flows through the Indian ocean. India has proximity to booming Middle East (ME) countries and fast developing South-East Asian countries. Transit time for goods from India to ME is 3-5 days vs 15 days from China and 20-22 days from India to Europe vs. 30-40 days from China. This provides an advantage to India vs its South-East Asian peers as significant savings can accrue from thousands of shipments travelling to and fro over the course of a year.
- 120mn+ UHNIs, HNIs and Upper-Middle Class
India has a huge base of 120mn+ people who have high disposable income to do discretionary spending. This base will drive the growth in domestic consumption – a key pillar of developed market economies, especially USA. This huge base also provides a large market to foreign companies looking to invest in India.
Now let’s assess the key challenges India is facing and what is being done to address them:
- Manufacturing Ecosystem
Most high-income Asian countries have grown on the back of manufacturing expansion. India’s manufacturing share as % of GDP has remained stuck between 15-17% for over a decade. India had set a target of 25% but has not been able to come close to that number yet. Some key inefficiencies responsible for this are:
- Power Cost
- Logistics Cost
- Ease of Doing Business
Let’s understand the depth of each of these:
- Power:
Power consumption per capita is the single most important indicator of industrialization level of a country. India is near the bottom when compared to other countries at just 1,440 kWh/capita.
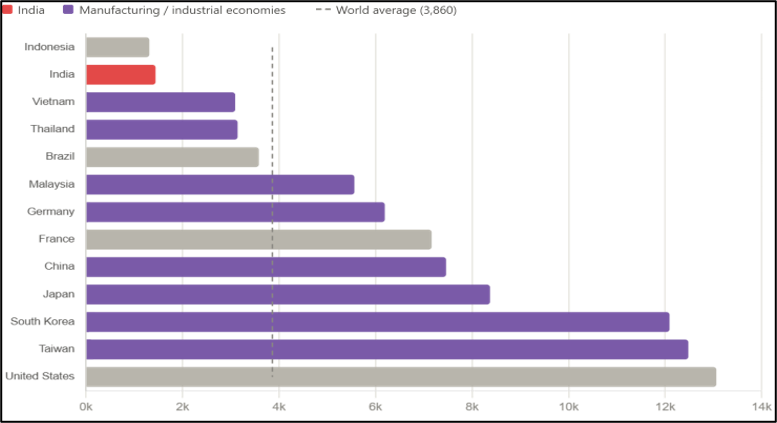
(Source: IEA, CEA, Ember energy)
With the advent of new technologies like EVs and Data Centers, power demand is only going to skyrocket. Power cost increase creeps into every single product/service that a country consumes. Therefore, availability of cheap and reliable power cannot be emphasized enough.
If we analyse the costs, base power cost in India is already competitive to rest of the South Asian peers and even China. Below chart shows cost of power on a per unit basis to industries in different countries.
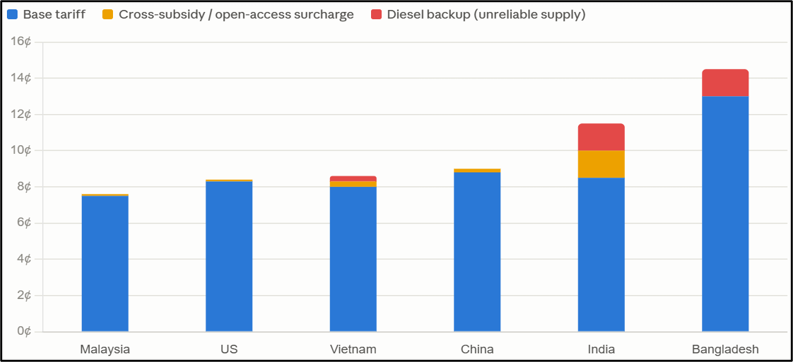
(Source: IEA, CEA, GlobalPetrolPrices)
Real problem lies in the inefficiencies of DISCOMs. For decades DISCOMs have suffered due to populism and lack of reforms which put them under a mountain of debt. Inefficient DISCOMs also resulted in lower availability of power which led to increased requirement of backup power. This coupled with cross-subsidy cost to subsidize farmers and residential customers; cost of electricity went up. This makes manufacturing at scale more expensive.
Reforms being brought to address this:
Government (GoI) introduced RDSS in 2021 which forced DISCOMs to clean up their act. GoI imposed late payment surcharge rules to ensure timely payment to generators. In addition to this, DISCOM privatization has also led to jump in efficiencies with more DISCOMs to be privatized in coming years. These reforms have led to huge reduction in AT&C losses over the last decade.
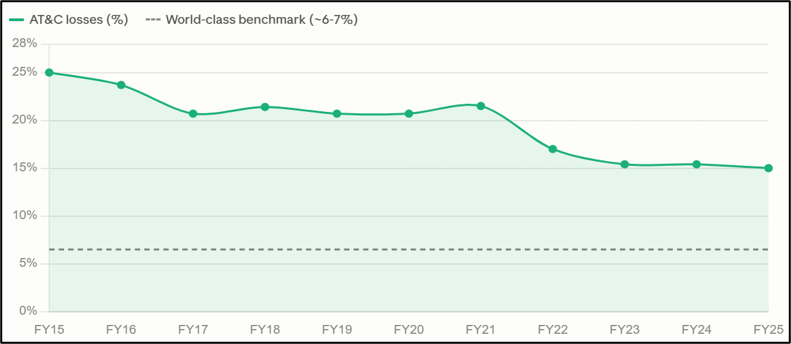
(Source: NITI Aayog)
States like Gujarat & Kerala have already come close to world-class benchmark of 7%.
Power theft & leakages are another major cause of weak DISCOM conditions. 250mn smart meters are targeted for installation to plug this gap. Most importantly, GoI has tabled Draft Electricity Bill which proposes total removal of cross-subsidy charges in 5 years. These measures, if implemented well, can bring power cost close to ¢9/kWh which would bring India at par with major manufacturing destinations.
- Logistics:
For years, India had very high logistics costs (likely in double digits as % of GDP). Compared to this, the World average was at 8%. This higher cost was on account of each state having separate rules, lack of physical infrastructure and departments not communicating with each other.
India has now brought this down to ~8% in recent years. This has happened on the back of strong reforms in the last decade. Introduction of GST and e-way bill cut highway transit times significantly. PM Gati Shakti, National logistics policy reduced inefficiencies by bringing in more integration. Dedicated Freight Corridors (DFC) created a separate high-speed line for goods. India has become the first country in the world to operate double-stacked container trains powered by electric locomotive and this has been enabled by DFC. Faster transit times meant better supply chain management and thus lower working capital requirements for businesses.
India still overwhelmingly relies on road transport as rail carries only 27% of the country’s freight. Compared this to China, rail and waterways carry 60% of freight. Cost of per km-tonne transport via road vs rail is Rs.3.8 vs Rs.2 on average. This massive difference means more savings as we shift from road to rail. Current cost of 8% of GDP can be brought down to 7% in the near term.
- Ease of Doing Business:
Beyond the frictional costs, businesses also assess the flexibility and compliance costs that come with investing in a country or a state. India historically has ranked low in ‘Ease of doing business’ ranking particularly due to gaps in contract enforcement, labour laws, insolvency process & a web of State and Central compliances.
Reforms being brought to address this:
Late last year, GoI took one of the most important steps towards resolving this issue. It folded 29 labor statutes into just 4 labor codes. More importantly, it changed the retrenchment threshold. Earlier, establishments with 100+ employees required government permission to fire their workers. This kept operations sub-scale as companies could not comfortably expand or consolidate at will. This number has now been raised to 300. Similarly, GoI has decriminalized minor offenses for businesses, brought in faceless assessment and introduced single-window clearances in the past few years.
One of the most important reforms of the last decade has been IBC which changed insolvency mechanism. It led to permanent change in corporate behavior and led to clean up of banks’ books and recapitalization of PSU banks which has made heavy loss-making PSU banks very profitable today. PSU banks were incurring losses of Rs.80k cr (~$11.5bn) in FY18 which stands at a profit of Rs.2L cr (~$21bn) in FY26. Asset quality is in a very strong position at system level today. Its mirror image is the corporate balance sheet today which is seeing lowest debt levels in past 2 decades.
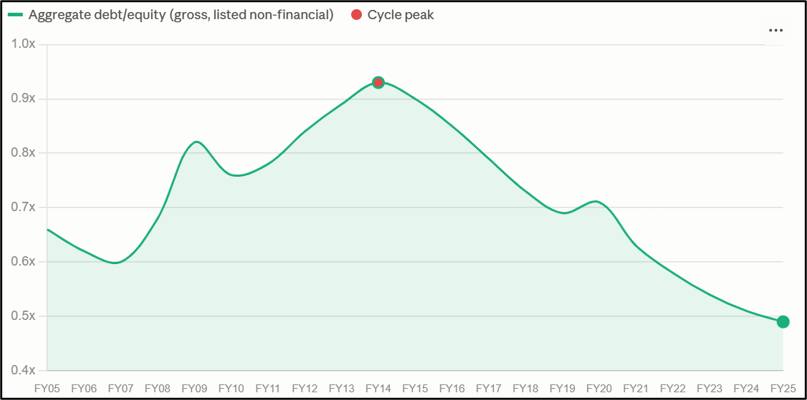
(Source: CareEdge)
This is also a result of very strong stance taken by India’s financial regulator. Stringent norms to stop aggressive lending, fixing recognition policies while supporting growth is credit to RBI. RBI has perfectly managed multiple storms like Covid, Commodity inflation cycle, Tariff wars and more recently the West Asia crisis. India has one of the best financial regulators in the world. These conditions create perfect environment for the start of a long capex cycle in the country.
One area where India is still lacking severely is contract enforcement. Enforcing a contract in commercial court in India takes on average 4 yrs vs. 100-400 days in US, China, Vietnam, Singapore etc. GoI has been actively trying to fast track resolutions and digitize records, but resolution of judicial structural bottlenecks will be gradual.
These reforms across power , logistics and ease of doing business should bring down inefficiencies in the system and bring more confidence to companies investing in expanding manufacturing in the country.
- Weakening Rupee
Rupee has depreciated 25% of its value against the dollar over the last 5 years. Currency depreciation is a double-edged sword – it makes exports more competitive but also increases inflation for a net importer country like India. It leads to foreign capital outflow which leads to further depreciation of Rupee. For India, Current Account Deficit (CAD) has been a primary reason for this weakness which hovers around 1-2% of GDP. Table below exhibits major import items for India:
| Imports (in $ bn) | FY26 | Composition |
| Total | 775 | 100% |
| Oil & Products | 174 | 22% |
| Electronics | 116 | 15% |
| Gold & Silver | 72 | 9% |
Above 3 categories constitute almost half the import bill. While commodities like Oil and Gold are difficult to displace, electronics was a major category where import substitution was possible. Government has recognized this and pushed for localization by providing incentives in the form of PLI as well as providing capital subsidies and trade barriers. Objective was not just to do ‘import substitution’ in domestic market but also to export which would lead to a double positive in supporting the rupee. The result of this push has been a strong scale up in exports of electronics over the last 5 years as observable in the chart below.
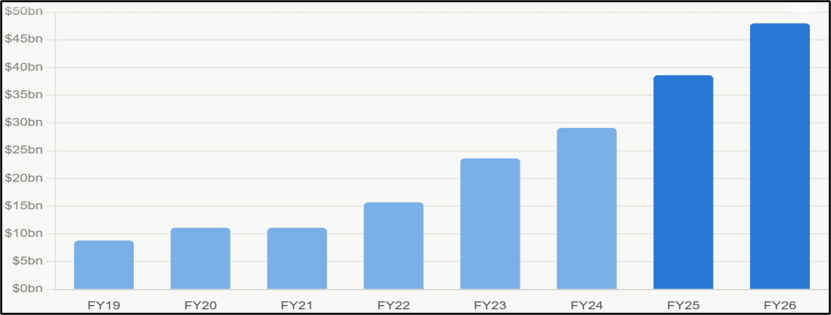
(Source: IBEF)
While there is still a trade deficit with respect to electronics, it will narrow as industry moves towards more value-add products. Currently, this is largely assembly work but scale up has been strong. India is already the second largest iPhone manufacturing base for Apple. Similarly, another segment that GoI has targeted is Defense. India is 2nd largest arms buyer globally. This concern is being addressed actively by the government. Exports of arms from India have rocketed in the last decade
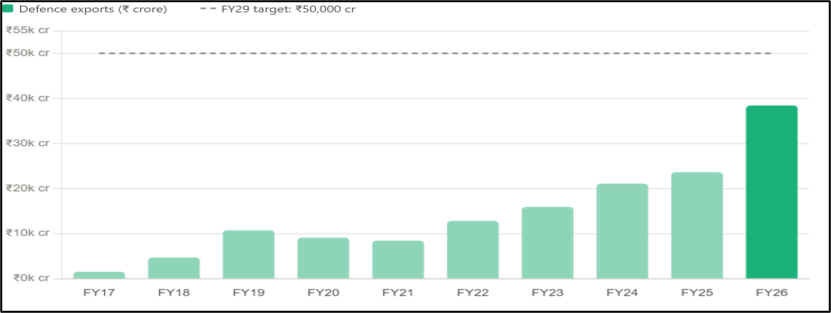
(Source: PIB)
This has been made possible on the back of multiple reforms which included heavy restructuring of PSUs, supporting private companies’ participation and fostering innovation. Currently, India is selling to small South-east Asian and Eastern European countries. With Europe preparing to spend upwards of $1tn on defense over the next decade, India is primed to take current $4.5bn export number to multiples of that.
GoI support for localization is present in many more sectors like Autos, Chemicals, Pharma, Textiles, Footwear etc. which will fructify over the coming years.
While creating a strong base for exports takes care of one side of the equation, demand for these goods is another part which needs to be solved. To have access to major markets, India has signed multiple FTAs in the past few years. India had signed 0 FTAs in a decade prior to 2021. Since then, 8 have been signed with EU, UK, Australia, Oman, UAE and near conclusion with largest economy in the world – USA. India is in active discussion with 24 more countries. This gives Indian goods preferential access to some of the largest markets in the world thereby boosting exports. Currently, India captures only 2.5% of total imports done by these countries so the headroom to grow is huge. Such initiatives across sectors will reduce imports and boost exports thus shrinking the CAD and subsequently supporting the rupee.
Other measures are also actively being engaged to address the Rupee problem like setting up Gift city to attract foreign inflows & providing infrastructure to trade rupee internationally on Indian terms.
- Energy Security
India relies on import for 85% of its oil consumption. This is a major national security problem as it gives oil producing nations a lot of leverage on India and leaves India vulnerable to oil price swings. It is tied to earlier rupee problem and has major repercussions on economy of the country.
Reforms being brought to address this:
60% of oil is consumed in the form of petrol and diesel. Government has mandated Ethanol blending in petrol to reduce oil consumption. At current E20 mandate, India saves gross $5-5.5bn every year (assuming Oil @$70/bbl) on account of this blending. For every 5% increased blending, India saves $1.2bn on a gross level which translates to a 5% reduction in CAD (on FY26 base).
Government is also evaluating isobutanol blending of upto 15% in Diesel. This can be a real game changer as consumption of Diesel in the country is 2x petrol. But this technology has not yet been validated like E20 widely has been. Nonetheless, this leads to considerable reduction in consumption of oil. Along with this, GoI has enforced stricter emission laws which led to more efficient engines thus reducing avg. fuel consumption with further stringent norms lined up in the next 5 years. GoI have also supported penetration of EV by providing incentives to OEMs and penalizing ICE players. One of the biggest successes has been rail electrification. A decade back more than half the trains was running on diesel. Today, India has completely electrified its rail network.
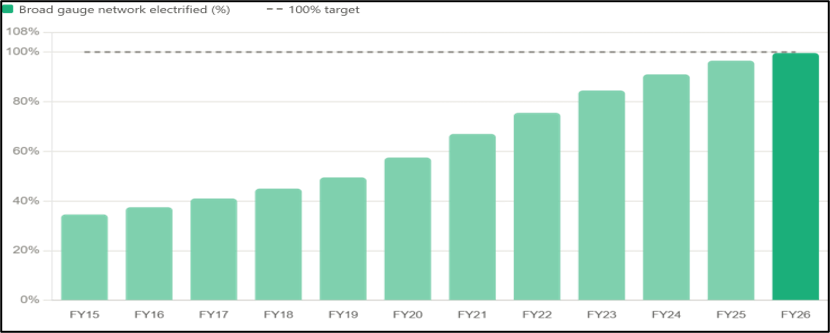
(Source: IBEF)
Our earlier discussion of logistics costs reform is tied to this oil problem as well. Almost a third of our diesel consumption today is done by trucks. As more freight shifts from road to rail, we can move away from oil and towards electricity (reemphasizing the value of power reforms discussed earlier).These measures have led to far slower oil imports. In the last decade, imported oil volume growth stood at 2.6% while India’s Real GDP growth stood at 6% CAGR.
If we substitute Oil with electricity, a lot of India’s problems are addressed in one go but if that electricity is generated with coal (which is also imported) the solution is only half-baked. So, India is aggressively investing in green technologies to meet its energy needs. India has already reached 250GW (50%) of installed base as renewables and target is to reach 500GW by the turn of the decade. Electricity from Solar+ BESS is already cheaper than sourcing from a new coal plant today. This should lead to faster offtake as economics are in favor of renewables. India needs to build out enough renewable capacity with full manufacturing integration to reach its target. Green energy also helps Indian industries comply with stringent EU import rules around use of clean energy which should support exports to the continent.
India is also working on making Green Hydrogen viable. Currently, target is set at 5mn tonnes of Green Hydrogen production. If it is able to scale to a level such that they can reach <$2/kg for Green hydrogen, it can replace significant portion of domestic gas consumption (mainly used in fertilizers) and also become a big exporter of energy to Japan and Germany who have planned imports of GH over the next 5 years.
- R&D Investments
India has historically been a low spending nation with respect to R&D and one of the lowest spenders in the world.
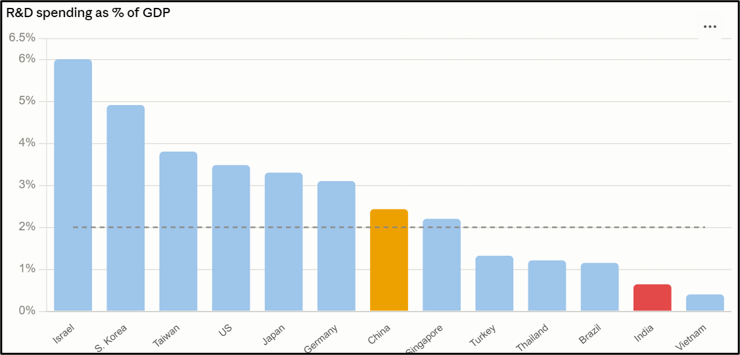
(Source: World bank)
This abysmal number is not on the back of low government spending alone. Private sector participation has also been dismal. Countries in the chart above see 75%+ of R&D spends in the country being done by private sector while for India that number is just 40%.
But spending remaining low has not stopped India from developing its own tech stack. There have been some real winners over the last decade:
- UPI was the most obvious winner. India accounts for ~50% of all global real-time payment transactions! UPI is now active in 8 countries incl. UAE, Singapore and more recently France and many more countries are looking to use the UPI rails. Fast, frictionless and free payment mechanism makes the economy more efficient.
- India’s digital tech stack has played a huge role in increasing financial inclusion in the country especially in tier 2,3 cities and beyond. Aadhar based verification is the backbone of strong increase in capital market participation over last 5 years. Demats opened went from 2.5cr to 21cr in the span of 10 yrs. Financialization of savings increased from 15% to 23%. This is important because every rupee that goes into capital markets is a rupee potentially less spent on buying gold (ties back to our earlier rupee problem)! There are many other second order effects like better access to formal credit, reduced leakages through DBT etc. that play a big role in improving financial inclusion which has a huge multiplier effect.
India excels in early-stage research. It is world’s third largest producer of scholarly publications. Where it lacks is converting it into innovative products. Government has recognized that private participation in R&D needs to be encouraged. So, GoI announced a Rs.1L cr. (~$11bn) RDI scheme late last year. It is on top of Rs.50k cr (~$5.5bn) existing ANRF scheme. These schemes are not enough to reach 2% R&D spend level but should bring behavioral change and provide initial patient capital required to build world-class technology. India has decades of catching up to do in this area and more policies need to come to support private participation.
- Infrastructure
Infrastructure addition has the biggest multiplier effect amongst all the major levers possible. India’s infrastructure is far behind developed economies and even lagging significantly vs. China. India’s urbanization level is at 37% compared to major economies at 80%+ and South-East Asian peers around 60%.
Current situation is India falls behind in stock but leads in flow. Over the past decade, India has grown its Highway stock by 60%, almost doubled its port capacity, Airports have doubled, Rail track addition pace up more than 3x while becoming faster and safer, Metros (Km) have grown 4x and installed power capacity has doubled with large renewables addition.
But there continues to be large gaps in critical national infrastructure. For instance:
- India lacks enough cold storage capacity to manage supply chain of its own food. An estimated 30-40% of the produce is wasted before it even reaches the consumer! Extensive network of cold storage and reefers are needed to be built while making it economically viable (cheap and reliable electricity is key) to tape this hole.
- Major Asian economies have 10-30% of their rail network as high-speed rail. India today is operating at 0%. To address this, government is building 7 high speed corridors which after completion takes India to 6-7% level – at par with Germany, Spain and Italy.
- For decades, India has lacked a deep-water port. Nearly 70-75% of container trans-shipment cargo had to be routed through Dubai, Colombo and Singapore which cost $200 per container! This led to millions of dollars as additional cost annually and increased transit time & fuel cost – hardly an attractive quality when you are trying to become a manufacturing export hub. An answer to this is Vizhinjam port which started late 2024. This port can safely dock the largest ships in the world. Government is doubling down on this by increasing the port’s capacity 5x over next 3 years.
India has showcased that it is able to execute megaprojects very well where – asset is greenfield, one agency owns it and outcome is measurable. At the same time, India has shown weak execution when – Land acquisition is required, many small players must contribute instead of 1 large institution & multiple jurisdictions are involved. A lot of investments are being poured into infrastructure to fill these gaps. India now invests 5-6% of its GDP in infra every year which is higher than its South-East Asian peers. Large projects along road, rail, ports and strategic sectors like defense and semiconductors are underway that should change the face of the country over the next decade.
So now that we have a grasp of where India stands, is India going the US way or the China way? It seems neither!
US’s secular growth cannot be matched as it has unique traits that make it one of a kind:
- Dollar Hegemony
- Military Industrial complex
- Culture of Innovation
- Plethora of natural resources
China is also not a comparable as it has always operated under autocratic rule which completely changes how policies are designed and implemented vs. a democracy.
India, instead, today sits in a position which is very similar to Japan in 1970s, Korea in 1980s and Brazil in 2000s. While the former 2 went on to see some of the most prosperous years from that point on, the latter was a lost promise. Brazil suffered from the Dutch disease – relying too heavily on its rich natural resources. So, when commodity cycle turned, they faltered. For India, not having enough natural resources has been a blessing in disguise!
There are a lot of similarities between India today and ‘70s Japan & ‘80s Korea:
- Demography
India has median age of 28-29 years today which is same as Japan in 1971 and Korea in 1989. Both countries saw their demography peak out in ~20 years. India is expected to hit its demography peak in 2041 – a 15-year window.
- GDP per Capita
GDP per capita of Japan and Korea in 1971 and 1985 respectively was at ~$2600 which is same as India today at ~$2,700.
- Credit/GDP
Credit penetration is a key enabler to growth of an economy. India’s credit/GDP stands at 55% today whereas Japan was at 80% in 1970 and Korea was at 65% in 1990. Japan and Korea today are at 180% and 130% respectively.
- Corporate Balance Sheet
Japan and Korea were forced to deleverage and clean their balance sheets post 1970 and 1998 respectively. Post this cleanup, both countries saw a decade of private capex explosion. As discussed in our blog earlier, India is already past its cleanup phase and is sitting on one of the best balance sheet positions it has ever seen.
- Chaebol System
In the 80s and 90s Korea had a Chaebol system where a small group of family-held businesses were backed by the government with credit in return for minimum export guarantees. This kind of risk capital on a large scale was necessary to absorb losses for years and build large industries (Samsung lost billions on semis over a decade before dominating the industry). Indian government is taking a page from the same playbook by throwing its weight behind conglomerates like Adani and Tata to build infra of national importance but with better fiscal prudence. Japan had MITI policy support which is like PLI in India today.
- Domestic Savings Institutionalization
Japan had a large Postal savings base which was channeled into bonds and equities – long-term domestic capital required to grow the economy. Similarly, Korea’s domestic pension funds provided the capital to the markets. India has a similar tool today with an SIP book of ~Rs.30,000cr ($3.5bn)/month – a stable inflow which gets invested every month by the citizens irrespective of the vagaries of the market.
However, there are areas where India lacks when compared to Japan & Korea:
- Urbanization
To increase productivity India needs to move people out of rural agri economy to urban non-farm jobs. Currently, India’s urbanization rate is only 37% whereas Japan & Korea were at 70% in ‘70s and ‘80s.
- Female Workforce Participation
India has low female workforce participation of roughly only 32%. Compared this to 70s Japan and 80s Korea, both had participation numbers close to 50%. If India takes the 32% to 50% it will add 1-1.5% to GDP growth permanently! This must be a non-farm based and manufacturing/services led employment. It is a big challenge but also a big opportunity for India – a potential massive demographic dividend without a single incremental birth!
- Investment to GDP
India’s investment/GDP is at a runrate of 30-31% which is similar to 70s Japan and 80s Korea, but the composition is what matters. India spends 11-12% of GDP on productive assets like machine and equipment (M&E) while the other 2 countries spent 16-18% of GDP on M&E – a 4-6% gap!
Where India has the upper hand?
- Technology/DPI
High penetration of internet and rails built on top of it make processes far more efficient and cheaper compared to 80s era. A decade’s worth of growth is now possible in a couple of years with technological productivity improvements.
- Domestic Consumption
India has a structural protection that Japan and Korea didn’t have. India’s private consumption is 57% of GDP and rising vs. 40% for 80s Korea and around 52% for 70s Japan (which kept declining) as both were mainly export-led economies. Heavy export reliance makes you venerable to global demand, currency fluctuations and competitor manufacturing. Having a strong domestic consumer base is a necessary pillar of GDP growth (recall India has 120mn+ upper middle class and above population)
- Non-Aligned Geopolitical Positioning
While Korea and Japan both were under US umbrella, India is more neutral as it is part of the QUAD, member of BRICS, actively trades with Russia and an important partner to the US (iCET).
Continuing this path over the next 2 decades led to phenomenal gains for Japan and Korea. Japan’s GDP/capita of $2,600 in 1971 went to $12,700 in 1981 and Korea went from $2,600 in 1985 to $13,600 in a decade!
Can India replicate the same? India can realistically go from $2,700 today to ~$11,000-12,000 GDP/capita by the time it hits its demographic peak in 2041 – in roughly 15 years.
There is one major swing factor which can significantly change this trajectory for India – AI. AI is the joker in the pack for a country like India. While US is the leader in AI technologies today, India has no direct AI play. India does not possess any technology in the field of GPUs, SSDs, chips or even large scale LLMs like Anthropic and OpenAI. Additionally, AI is a direct threat to the $300bn IT services exports we talked about earlier. AI makes coding, backend ops, testing and maintenance far less labor driven which directly substitutes what IT companies provide. And the effects are already visible – TCS, India’s largest IT services provider, laid off ~12,000 employees in FY25 which is the highest in the firm’s history. But AI also provides India with significant opportunities. Firstly, while IT service providers are taking a punch in the face, GCCs are booming in India. Instead of outsourcing work to IT firms, corporates are setting up GCCs in India where they are doing value-added work like product engineering & development while owning the IP. AI will support this higher value-add GCC activity. India already holds >50% market share of global GCCs. Secondly, AI requires more and more Data Centers to be built every passing day. India has amongst the fastest connectivity timeline and amongst the lowest capex/MW as compared to all the hot Data Center (DC) destinations in the world today. Most countries today have data privacy concerns when it comes to China, so India becomes a very compelling proposition to become a DC base.
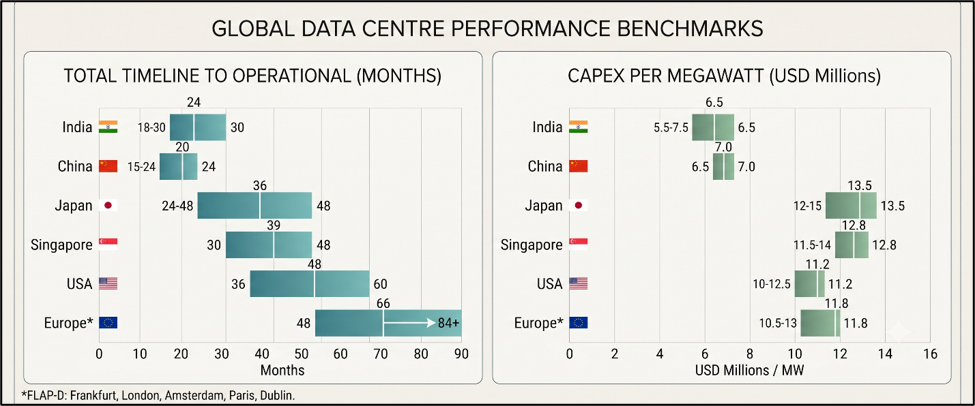
Source: IEA, KPMG, JLL)
GoI has already announced 20 yr tax breaks for foreign cloud service providers using Indian DCs. India is also competitive on electricity prices – the key operational expense for DC operators (again ties back to our earlier discussion on electricity reforms). Thirdly, AI can have implications across many sectors and can provide solutions to many of the issues that we discussed in earlier sections. For eg. India has 21 judges per million against a required 50, 1 doctor per 1500 people and severe lack of skilled teachers and administrators esp. in rural areas. So more than the fear of substitution, there is an issue of skilled professional deficit which AI can fulfil at scale and fraction of the cost. Lastly, India’s DPI stack provides access to large payments data (richest transaction dataset in the democratic world!) and a consent-based data-sharing rail.
Where it lacks is credit as that requires risk assessment. AI can do cash-flow based underwriting based on this data at scale, especially for small loans where cost structure today makes no economic sense. India’s credit to GDP is only 57% vs. world average of 148%. Filling this gap will add 2-3% to India’s GDPgrowth for 20-30 years!
Now let’s tie all this to equity markets!
China grew leaps and bounds in the last 2 decades, but we saw at the beginning of this note that returns for an investor who invested in Shanghai index in 2007 has essentially made a total of 0% (or negative) in 20 years! Problem was China in 2007 was very expensive with a P/E of 50-60x. India is often touted as ‘expensive’ by some investors based on P/E comparison.
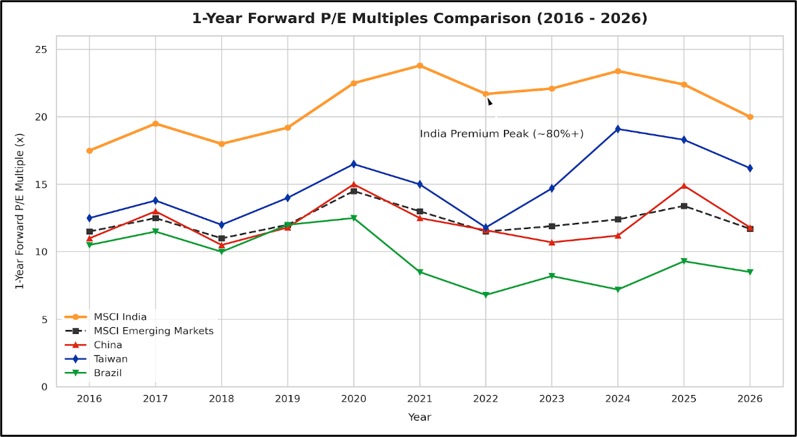
(Source: Bloomberg)
There are 2 reasons, absolute P/E might not be the correct way to look at India –
- Firstly, a premium is assigned by market to a country based on its potential. Japan in 70s and 80s continued to remain ‘P/E expensive’ while giving great returns for 2 decades (later collapsed on the back of demography collapse, poor monetary policies and more importantly the Plaza accord!). Brazil continued to be far ‘cheaper’ P/E wise compared to India over the last 2 decades, but India’s returns have outperformed Brazil’s returns over that period consistently even on USD terms.
Secondly, should we look at P/E graph in isolation? P/E paints a static picture. What matters most for equity investors is earnings growth and quality of those earnings. So, a more relevant metric to compare would be PEG/ROE (Price/Earnings divided by earnings growth which is divided by ROE) – how much are we paying for per unit of growth and per unit of quality. How does India look vis-à-vis other countries based on this metric?
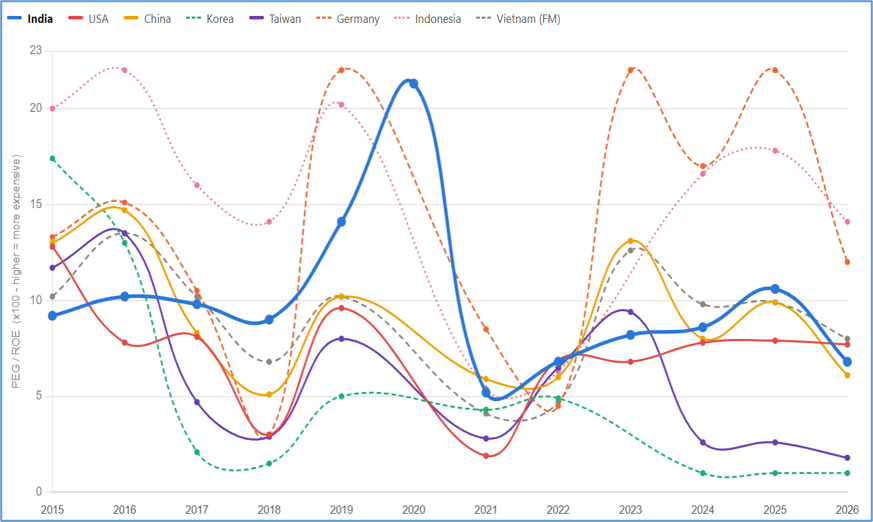
(Source: MSCI, JPM, Siblis. MSCI indexes of major economies (ex-financials) compared on 1-yr forward PEG/ROE basis over last 10 yrs. Individual indexes not considered as they are not directly comparable due to different levels of market cap coverage by index of respective exchanges)
India (blue) looks far more reasonably priced when we compare valuations from this lens. Only Taiwan and Korea look significantly cheaper than India and all other peers are more expensive or at par with India. Both Taiwan and Korea face the same issue – handful of companies form majority of the market so a highly cyclical market. Also, looking at 10 yr trend of India on this chart, India today is at the lowest valuation it has seen in a decade (ex-covid).India also offers good market depth compared to all other markets barring the US. No country can offer the depth that US market provides. US leads in terms of market capitalization which stands at ~$72Tn. China is a distant 2nd with $10T while India is 4th with ~$4.5T. In all other major factors contributing to depth like no. of listed companies, retail participation, derivatives sophistication, India is second only to the US! Even in terms of new companies which can potentially get listed in the next 24 months, India stands 3rd behind US and China. One area where India is behind is foreign ownership which is only 16%, the lowest it has been since 2009.
So, to sum it up, over the past decade India has done a lot of heavy lifting and laid the foundation for future growth. Structural gaps have been identified, and government is taking the learnings from countries like Japan and Korea to solve long term problems. Precedence is already established and if execution is strong, next 15 years can be India’s golden period of fastest growth window India has or will ever see.
We look forward to hearing your valuable feedback and suggestions on our knowledge series notes. We shall continue to take up interesting topics to help educate you further and in turn learn from you via your feedback. We hope you enjoyed reading this note.
Warm Regards,
Neel Shah
Senior Research Analyst
SageOne Investment Managers LLP
Legal Information and Disclosures
Any performance related information provided above is not verified by SEBI.
This note expresses the views of the author as of the date indicated and such views are subject to changes without notice. SageOne has no duty or obligation to update the information contained herein. Further, SageOne makes no representation, and it should not be assumed, that past performance is an indication of future results.
This note is for educational purposes only and should not be used for any other purpose. The information contained herein does not constitute and should not be construed as an offering of advisory services or financial products. Certain information contained herein concerning economic/corporate trends and performance is based on or derived from independent third-party sources. SageOne believes that the sources from which such information has been obtained are reliable; however, it cannot guarantee the accuracy of such information or the assumptions on which such information is based.