
Dear Investors,
I am pleased to share our new note as a part of our ‘Knowledge Series’ initiative on “Looking beyond just performance return %”. In our previous knowledge series note, my colleague Kshitij had explained the nuances of emerging Platform Businesses in the backdrop of evolving digital world.
The idea of penning down this note came after completing my recent assignment of evaluating SageOne portfolio(s) performance on key established risk adjusted parameters. The objective of this assignment was to get more insights on our superior performance track record across market cycles. In this process of evaluation, we as team also realized how imperative it is for the investor community to understand and evaluate a fund managers performance beyond just the return % – to gauge what risk the fund manager has taken in the portfolio to generate those returns, what is the sensitivity of the portfolio to market benchmarks during market upturns and downturns, how fast a portfolio recovers from drawdowns compared to market benchmarks etc.
This note is an attempt to decipher key concepts and terminologies of risk adjusted performance statistics. Risk adjusted performance provides better view of the underlying investment strategy. I have also exemplified the interpretation of various stats like Beta, Volatility, Sharpe ratio, Capture ratios etc. The equations are presented and explained in plain English rather than usual statistical (stats) definitions. Incremental value addition of each performance stats is explained through a case study approach. The “fund” represents SageOne Core Portfolio (SCP) and its performance stats are discussed. Nifty 50 TRI (Total Return Index) is used as the market benchmark index (please refer Annexure 1). The similar stats for SageOne Small Cap Portfolio (SSP) are captured in Annexure 2.
Correlation
Correlation measures how two variables move with respect to each other. In present context, movement of fund with its benchmark is analyzed. Correlation values lie between +1 to -1.
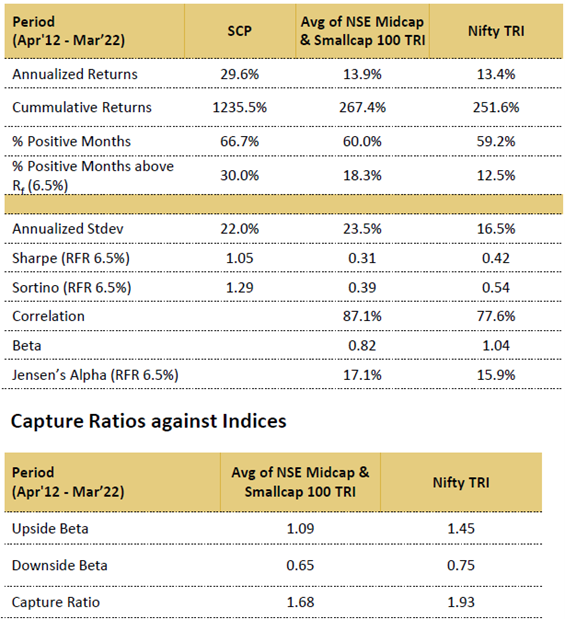
→ Positive correlation indicates fund and index move in same direction. SCP has 87% correlation with its benchmark.
→ Negative correlation implies opposite movements i.e. if index moves up, fund would move down.
→ Zero correlation means there is no meaningful relationship between the two variables.
Beta
Beta is a measure of systematic risk of the portfolio compared to the market. A beta of 1.5 is interpreted as – if market moves by 2% then fund will move by 3% (beta times the market movement = 1.5*2%).
Higher beta funds tend to be volatile and show large values in up and down markets while low beta funds show muted returns.
Capture Ratio
Let’s extend the beta analysis a step further by bifurcating the benchmark returns into positive and negative returns.
If only positive returns of the benchmark are used for beta calculation, it would help to understand the fund performance when market is going up. This measure is called Upside beta. SCP has upside beta of 1.45 – it means for every 1% up move in the benchmark, SCP delivered 1.45%. Higher the upside beta, better is the fund performance.
Similarly, downside beta measures fund performance when index is down. Downside beta should be less than 1 – indicating for every 1% down movement in index, fund falls less than 1%. SCP’s downside beta is 0.75.
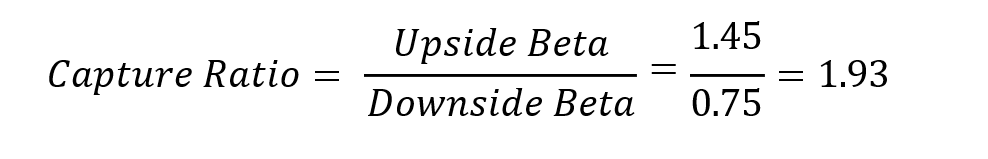
A ratio of upside beta and downside beta is called capture ratio. Higher the capture ratio better the fund.
Volatility
Volatility measures dispersion of returns. High volatility implies high risk. Probability of observing large negative returns increases with higher volatility. Standard deviation of returns is used to compute volatility.
In market parlance it is said higher returns come with higher risk. Ideal scenario would be high returns with low volatility. Two such stats which provide risk adjusted returns – Sharpe Ratio and Sortino Ratio are discussed below –
- Sharpe Ratio
Sharpe ratio measures excess return delivered per unit of risk. Higher the Sharpe ratio, better is the risk adjusted performance.
Fund return above risk free return is called excess return. Assuming risk free rate of 6.5%, excess return for SCP is 23.1% (29.6% – 6.5%). SCP Sharpe ratio is 1.05 indicating for every unit of risk fund delivers same return. Sharpe ratio for benchmark Nifty 50 TRI is 0.42. On risk adjusted basis, SCP performs better than the benchmark.

- Sortino Ratio
If only negative returns are used to compute volatility, it is called downside deviation or downside volatility. The focus here is to understand risk only during down times.
If volatility is replaced by downside volatility in Sharpe ratio equation, we get Sortino Ratio.
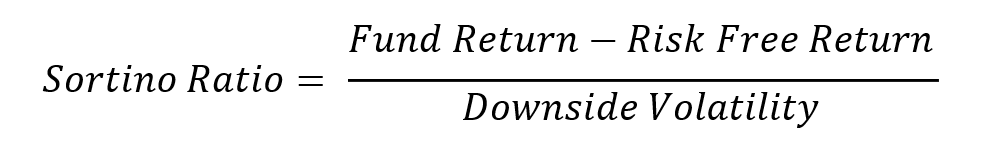
Higher the Sortino ratio better the fund. For the same amount of excess return, a fund with low downside deviation is a better choice.
Sortino ratio for SCP is 1.54 while Nifty 50 TRI reports 0.54.
Information Ratio
Difference of fund return and index return is called active return. Ratio of active return to the volatility of active return is called Information Ratio.
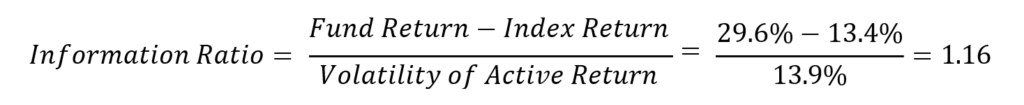
Higher the information ratio, better is the fund strategy vis-à-vis index. SCP information ratio is 1.16 indicating more active return per unit of active risk.
Jensen Alpha
Fund outperformance with respect to benchmark is measured in terms of Jensen’s alpha. Higher the alpha better the fund.
𝐽𝑒𝑛𝑠𝑒𝑛 𝐴𝑙𝑝ℎ𝑎 = (𝐹𝑢𝑛𝑑 𝑅𝑒𝑡𝑢𝑟𝑛 − 𝑅𝑖𝑠𝑘 𝑓𝑟𝑒𝑒 𝑅𝑒𝑡𝑢𝑟𝑛) − 𝛽 ∗ (𝐼𝑛𝑑𝑒𝑥 𝑅𝑒𝑡𝑢𝑟𝑛 − 𝑅𝑖𝑠𝑘 𝑓𝑟𝑒𝑒 𝑅𝑒𝑡𝑢𝑟𝑛)
Jensen Alpha has two components – first is excess return of fund and second component is beta times excess return of benchmark.
Jensen alpha calculation for SCP is explained below –
𝐼𝑛𝑝𝑢𝑡𝑠 → 𝐹𝑢𝑛𝑑 𝑅𝑒𝑡𝑢𝑟𝑛 = 29.6%; 𝑅𝑖𝑠𝑘 𝑓𝑟𝑒𝑒 𝑅𝑒𝑡𝑢𝑟𝑛 = 6.5%; 𝐵𝑒𝑡𝑎 = 1.04; 𝐼𝑛𝑑𝑒𝑥 𝑅𝑒𝑡𝑢𝑟𝑛 = 13.4%
𝐽𝑒𝑛𝑠𝑒𝑛 𝐴𝑙𝑝ℎ𝑎 = (29.6% − 6.5%) − 1.04 ∗ (13.4% − 6.5%) = 15.9%
Maximum Drawdown (Max DD)
Max DD measures largest price drop from peak to trough before attaining new peak. A simple way to interpret Max DD is – it is the maximum loss one would have seen during the investment period. Keeping all other performance stats constant, lower drawdown is preferred.
To summarize, risk adjusted performance stats provide much deeper understanding of the fund performance and is also useful for peer comparison. We hope this note helped you in gaining more understanding on key performance stats and how to interpret them in evaluating a fud manager performance.
We look forward to hearing your valuable feedback and suggestions on this initiative of ours and on our part, we shall continue to take up interesting topics to help educate you further and in turn learning from you via your feedback. We hope you enjoyed reading this note
Warm Regards,
Anand Sabale
Chief Quant Strategist
SageOne Investment Managers LLP
Annexure 1
SageOne Smallcap Portfolio and SageOne Core Portfolio rank #1 and #3 in top 30 portfolio management services as of 31st March 2022 based proprietary QRC (Quality, Risk, Consistency) framework of PMS AIF World.


Note: Above ranking is based on Information Ratio (SI)
Annexure 2
Risk parameters for SageOne Core Portfolio as presented in our product offering document as on March 31, 2022.
Annexure 3
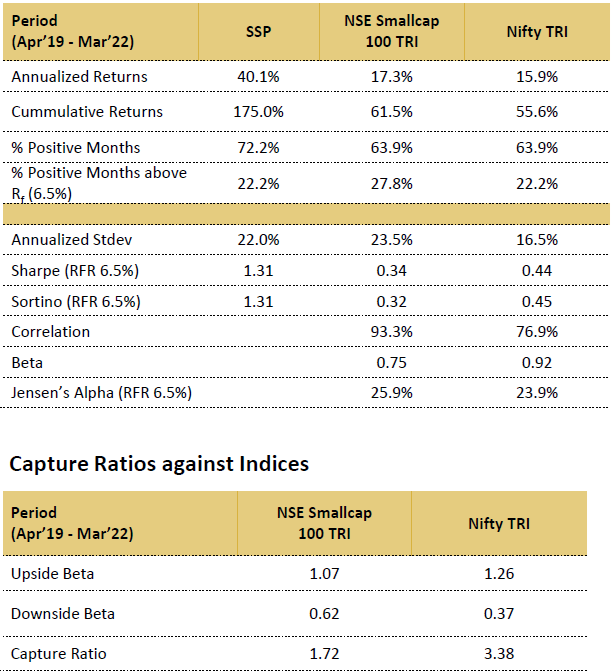
Risk parameters for SageOne Smallcap Portfolio as presented in our product offering document as on March 31, 2022.
Legal Information and Disclosures
Any performance related information provided above is not verified by SEBI.
This note expresses the views of the author as of the date indicated and such views are subject to changes without notice. SageOne has no duty or obligation to update the information contained herein. Further, SageOne makes no representation, and it should not be assumed, that past performance is an indication of future results.
This note is for educational purposes only and should not be used for any other purpose. The information contained herein does not constitute and should not be construed as an offering of advisory services or financial products. Certain information contained herein concerning economic/corporate trends and performance is based on or derived from independent third-party sources. SageOne believes that the sources from which such information has been obtained are reliable; however, it cannot guarantee the accuracy of such information or the assumptions on which such information is based.