
Dear Investor,
Global markets have rebounded sharply, recovering most of the losses incurred because of the COVID 19 pandemic in the backdrop of historical GDP drop, earnings drop and uncertain economic environment. It’s been a classic case of markets climbing a wall of worry. Talks of markets going up only because of liquidity without any fundamental reasons and reaching bubble territory valuations have reached high decibels. More on this later.
SageOne Portfolio Performances
Our small and micro-cap portfolio (SSP) – launched in April’19 at a time when this space was out of favor, comprising companies with strong fundamentals and attractive valuations – continued to be the best performer amongst all our offerings. In the last one year (July’20) it was up 30% when the Nifty Small 100 index was down – 9.3%, an alpha of nearly 40%. The performance was mainly driven by earnings growth. For FY20, the portfolio companies increased their earnings by more than 30% (median). More impressive was their median earnings growth of 14% in the March’20 (YOY) quarter vs -23% for BSE 500.
When we launched this new offering early last year, it was extremely difficult to convince investors to invest in small caps, but we were really glad to see investors believing in us and helping us complete our targeted fund raise of INR 100 cr in a short period of time. For a stock picker, small cap is an exciting universe to find multi bagger stocks but for a fund manager it’s a very restricted space to scale up as a business. If one tries to scale it up, it becomes risky for the investors as liquidity and timely exits are difficult to manage. Hence we restricted our fund raise in SSP to only INR 100 cr even though we can comfortably manage 2-3x of this size given the average market cap in the current SSP at above INR 3,000 cr.
Our mid and small cap offerings (SCP and SDP) are up 11.8% and 5.5% over the last year vs – 6% drop for the comparable indices (average of Nifty Mid 100 and Nifty Small 100) generating alpha of 12 to 18%. Detailed year wise performance tables are presented at the end of this memo.
More on Market Timing, Liquidity Driven Rally and another Crash/Bubble
These are extremely difficult aspects of the market and very few get them right and that too once in a while if they are lucky. The bottom-line remains that whenever extreme fear grips the market and enough investors exit, it doesn’t take much liquidity for the markets to rebound as very few sellers exist for the buyers to buy from. March end this year was a recent example. The reverse works during times of euphoria.
In the Indian context, let me present some facts on liquidity (easy reason given for the rally) over the past few months. I have clubbed the shareholding into three big groups of investors, viz. Promoters, Institutions (Domestic – DII and Foreign – FII) and others (retail, HNIs, PMS etc.). Following is the consolidated data for the largest 1000 listed companies.
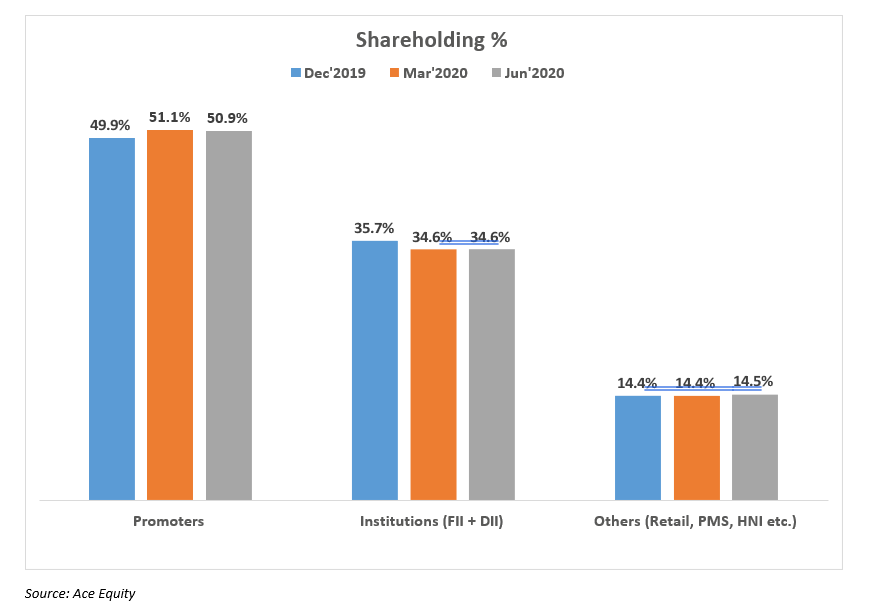
As you can see, promoter shareholding has increased by 1.0% since December 2019, while it’s gone down for the institutions by 1.1%. For others it’s been almost flat between March 2020 and June 2020. In reality promoters were the only category who have bought and that’s not a bad thing.
Value of Ownership by Category for the 1000 Largest Listed Companies on NSE

In CY 2020 (until Jul’20) the net inflow of liquidity from institutions has been around INR 11,000 cr and since April 1, 2020 it’s been around INR 21,000 cr. As of August 7 ’20, Promoters owned 1% higher (vs Dec’19) equity or around INR 1.47 lac cr more out of the total market cap of INR 147 lac cr. Numbers don’t indicate increase in ownership by institutions, HNIs or retail significant enough to suggest liquidity driven rally.
Market Crash Talk
Market crashes and bubbles are rare occurrences that are almost impossible to predict. Since 2011, many legendary investors have been warning of crashes because of central banks driven liquidity artificially holding up asset prices. It may happen one day, but when and what triggers it is difficult to know. Let’s look at the current situation (COVID 19) using a modified version of the “Johari Window” framework created by psychologists Joseph Luft and Harrington Ingham in 1955.
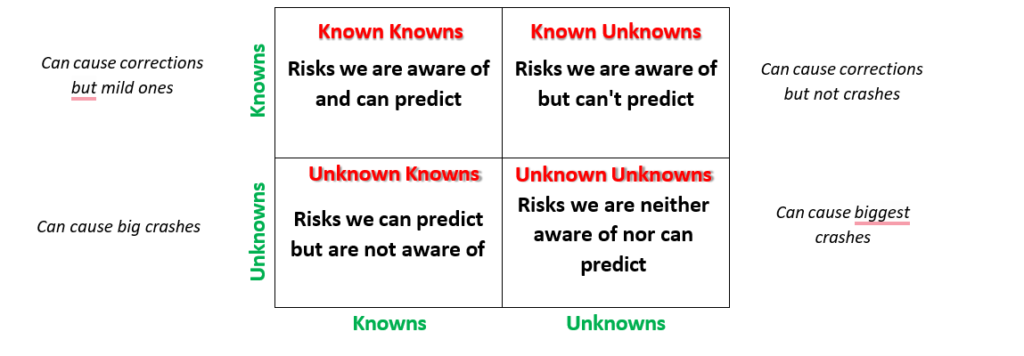
Unknown Unknowns: (Black swan events occur in this quadrant). At the start of March’20, COVID 19 was an unknown risk to all and at the same time no one understood exactly how the risk will play out. As the knowledge spread fast and economic lockdown started, almost everyone could comprehend the risk. Unfortunately by that time the markets had already crashed more than 35%.
Known Knowns: Today the COVID 19 risk is known to everyone and the impact from it over the next few months is also reasonably understood. Investors take such risks in their stride and it’s highly unlikely that markets will crash because of it.
Known Unknowns: Beyond a few months, even though the risk of COVID 19 is known, what happens once the moratorium ends and whether we will have an effective vaccine is unknown. Markets typically try to price in some estimate and in this scenario how the reality plays out compared to this estimate will generally determine the market direction. Markets correct due to these but don’t crash.
Unknown Knowns: These are risks we understand but are unaware of. When a massive nuclear attack will happen is unknown, but the risk from is known. Such events are also reasons for big market crashes.
Market timing works in the lower two quadrants if and only if you are ahead of everyone else in understanding the risks. Being ahead of the market generally doesn’t happen, and even if it does, luck plays a big factor in addition to your ability to execute quickly. In the upper two quadrants market timing isn’t worth the opportunity cost. Unfortunately many investors try to indulge in market timing in the upper two quadrant scenarios and end up missing out on big rallies. Markets generally are ahead of most of us in these quadrants in pricing in the risks and by the time we act, it’s too late.
I generally advise the clients to focus on asset allocation. Even if one missed getting out during the March crash, his/her equity allocation would have dropped significantly. During such times when most risks are well known (Known Knowns) and valuations are attractive, it makes sense to re-balance your equity allocation at least to the targeted level if not higher.
Bubble Talk
Bubbles occur in times of extreme euphoria in a particular asset class. Euphoria also reflects in valuation. It would be gutsy to call current sentiments as euphoric. Neither does funds flow indicate that (as presented earlier), nor does anecdotal evidence of talking to many investors or HNIs/Ultra HNIs indicate that. In my conversations with many of our large investors, I get a sense that almost everyone is very worried about the equity markets and accordingly they seem to be holding above average levels of safe assets such as cash, gold and liquid funds.
I had presented valuation graphs in my last memo and hence don’t want to repeat those. Of course valuations have jumped significantly since then and there is no doubt that currently the PE multiples for the Indian indices are significantly above the historical averages. For the largest 100 companies the median PEx is just above 30x vs 19 year historical average of 24x. For the small cap companies (next 500 beyond top 250) the current median PEx is around 14x vs historical average of around 17x.
Many times PEx can be a misleading indicator of valuation as temporarily earnings are sharply depressed and multiples look grossly inflated. PBx is a much more stable indicator. Currently the median PBx for the top 100 is at around historical average and for the small cap companies its more than 20% below average.
There is a debate and discussion going on in the investment community whether the low bond yields should have an impact on the valuations we pay. Howard Marks in his latest memo “Time for Thinking” has also provided a perspective on the topic just as an argument and not as his supportive view. The demanded earnings yield from equities could be (Bond yield + equity risk premium – growth) = 2%; assuming 2% terminal earnings growth rate for S&P500. Given that PE= 1/earnings yield, a multiple as high as 50x can be justified and stocks have a long way to go if you were to use this theory.
Using the above theory, India should always trade at lower multiples than the US. This has rarely been the case as India generally trades at premium valuation not only to the US but also to most high growth emerging markets. Even though the above theory can’t be relied upon, I believe that the expected returns from the investors have a significant impact on valuations. Let me showcase my point with an extreme example on how sensitive PE multiple can be. Let’s assume two companies with identical profitability, growth and free cash flows (FCF). The only difference is the discount factor (expected returns) used to discount the FCF. Below are the assumptions:
- Initial equity = 100
- ROE = 25%
- Initial 10 years: reinvestment rate of 80% delivering 20% earnings growth
- Beyond 10 years: reinvestment rate of 40% delivering 10% earnings growth to infinity
- No use of terminal value, but just sum of discounted FCF for many years
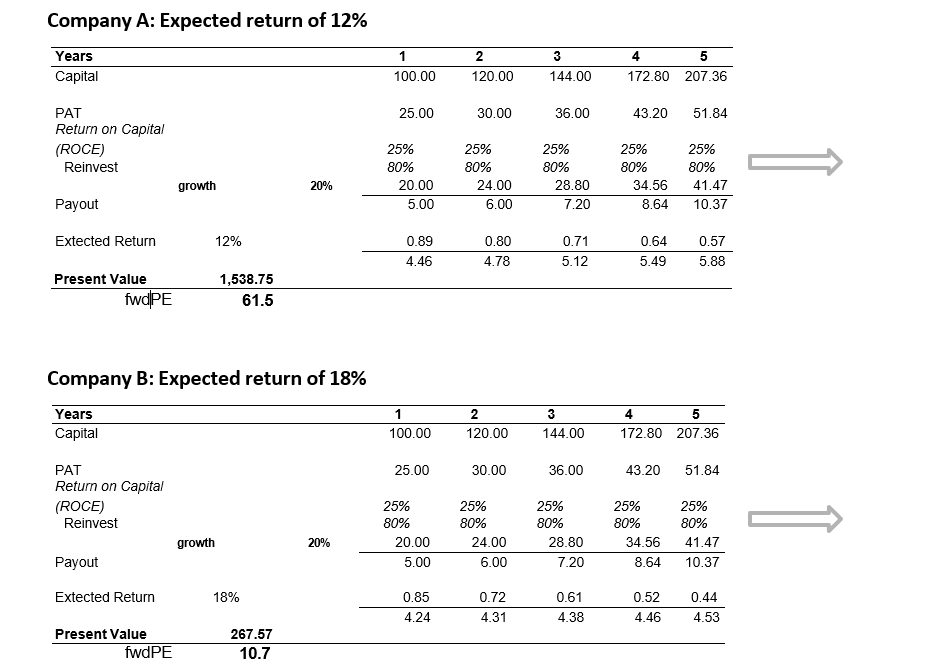
As you can see, for the exact same FCFs, the valuation differential is almost 6x just because of the difference in expected returns. As the bond yields (risk free rate) fall, a much higher valuation multiple can be theoretically justified.
I believe that the relationship between expected return and bond yield isn’t just mathematical. In a risky environment, investors will invest only if the expected returns are much higher compared to a less risky environment. So in reality when there is fear in the market, expected returns go up even though the bond yields may fall. Continuing with our COVID 19 experience, during March in an extremely uncertain environment, the expected return by investors across the globe had to be high compared to now as risk off has turned into a risk on environment. No wonder we see a sharp jump (40% higher in most markets) in valuations for the same reality (future FCF).
Bottom line is that valuation multiples are very volatile and shouldn’t be used as a reliable tool to make market timing decisions.
Our Strategy and Learnings
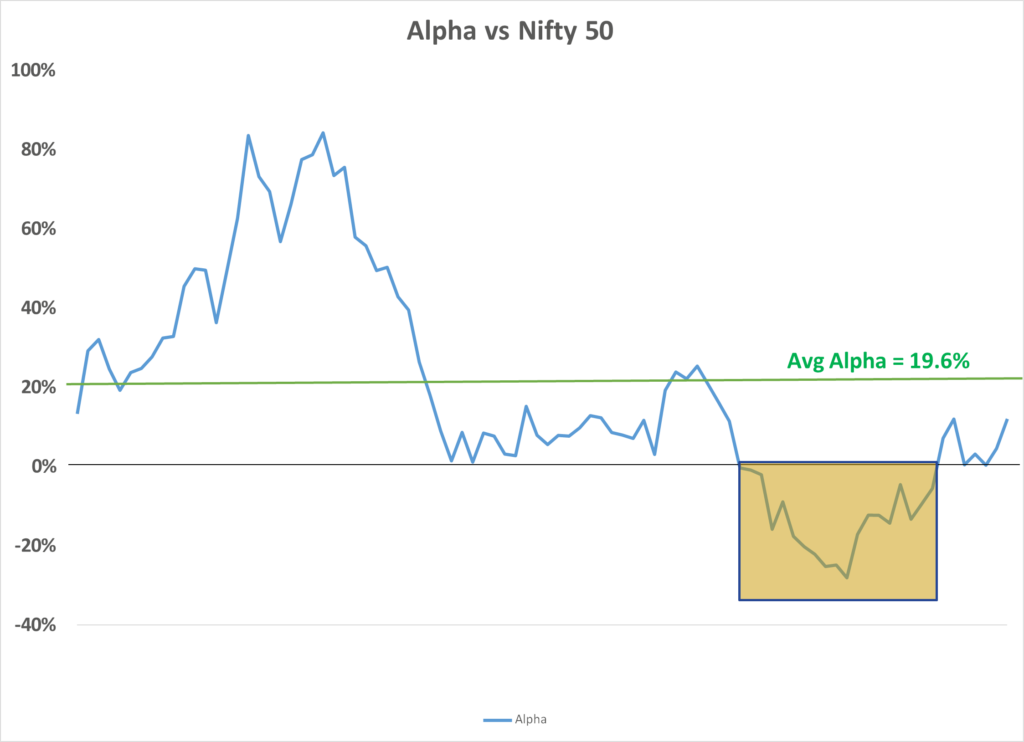
In our history of professional fund management since April 2012, we have outperformed the Nifty 50 during 80% of the time. If we look at trailing 12 months performance at the end of every month for our longest running flagship portfolio (SCP), we had negative Alpha (outperformance vs Nifty 50) during an 18 months period in 2018-2019. This was a period when large caps significantly outperformed the others. We have resumed our outperformance since Jan’20 and hope to maintain for most part of the future. Our historical average Alpha has been closer to 20%, but we had never targeted it to be that high. Our target then and even now is around 10% which is also the same level we target for earnings growth differential. That’s been the sole reason for our outperformance.
I am completely aware of how painful the underperformance period has been for you. It was excruciatingly painful for us too, not because of similar portfolio losses for us, but seeing your portfolios in red and mainly not meeting your expectations from us. We have done a lot of retrospection on this period of underperformance and hope that we don’t let this crisis go waste and leverage our learnings from it to improve future returns. The biggest learning has been to be proactive in exiting any businesses where we see structural headwinds. It’s better to exit and sit on the sideline rather than riding through the storm.
Changes to the Portfolio
In our last memo, I had presented how highly correlated the topline growth of corporate India has been with the credit growth. India’s banking sector was already in a stressed condition and with the ongoing moratorium it may get much worse. In this scenario, I don’t believe that you can rely on broad based economic growth as a basis for investment. Accordingly we have made significant changes to our portfolio in the last year by exiting companies (auto, lending, industrial businesses etc.) that tend to rely on broader economic growth for their earnings growth and entering companies (pharma, agri-input, fee based finance businesses etc.) that are relatively independent of it. We are glad to see that the average returns for our new companies since entry has been around 20% vs -10% for the exited companies.
We will strive to do our best to deliver on your high expectations from us. I once again want to thank you for believing in us through these testing times.
Warm Regards,
Samit S. Vartak, CFA
Founder and Chief Investment Officer (CIO)
SageOne Investment Advisors LLP
Email: ir@SageOneInvestments.com
Website: www.SageOneInvestments.com

*SageOne Investment Advisors LLP is registered as an Investment Advisor, PMS and AIF with SEBI.
Appendix – 1
SSP Portfolio* Performance (Net of Fees)
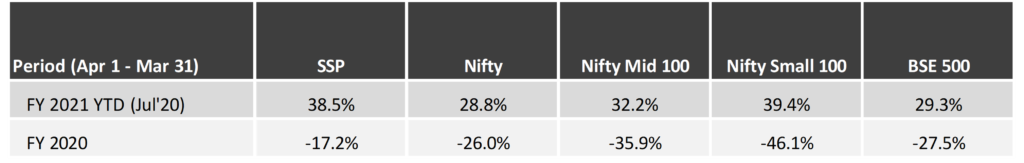
Source: SageOne Investment Advisors, Bloomberg, Wealth Spectrum
*SSP (SageOne Small&MicroCap Portfolio) portfolio is composed of 12-20 stocks with Mcap ranging from 500 cr to 5000 cr. This scheme was launched last year. Average Map 3,200 cr
SDP Portfolio* Performance (Net of Fees)
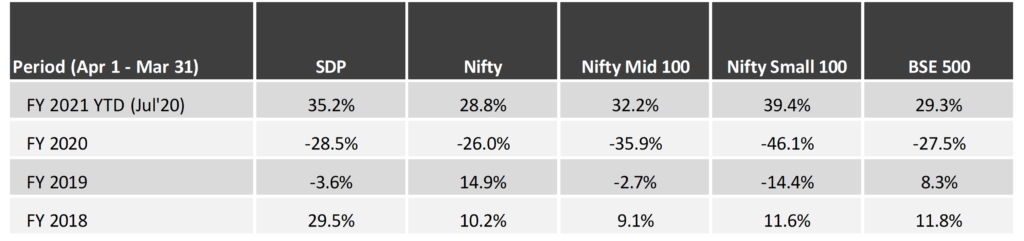
Source: SageOne Investment Advisors, Bloomberg, Wealth Spectrum
*SDP consists of 22 equal weighted stocks as of Jul 31, 2020. Average Mcap 9,900 cr
SageOne Core Portfolio (SCP) Performance (Net of Fees)
For the first three years, we managed proprietary funds and for the last 8 years and 4 month, we have been advising/managing funds for external clients. Since clients have joined at various stages, individual performance may differ slightly based on the timing of purchases. For uniformity and ease, we measured our IA performance using a “representative” portfolio (that resembles advice given to clients) and we call it SageOne Core Portfolio (SCP). SageOne core portfolio is not a dummy/theoretical portfolio but the CIO’s actual total equity portfolio. The representative portfolio until FY17 was reviewed by KPMG. Post that the performance is for the PMS scheme. Calculated on a TWRR basis for the entire period.
11 Years 4 Month Performance in INR (Apr 2009 – Jul 2020)
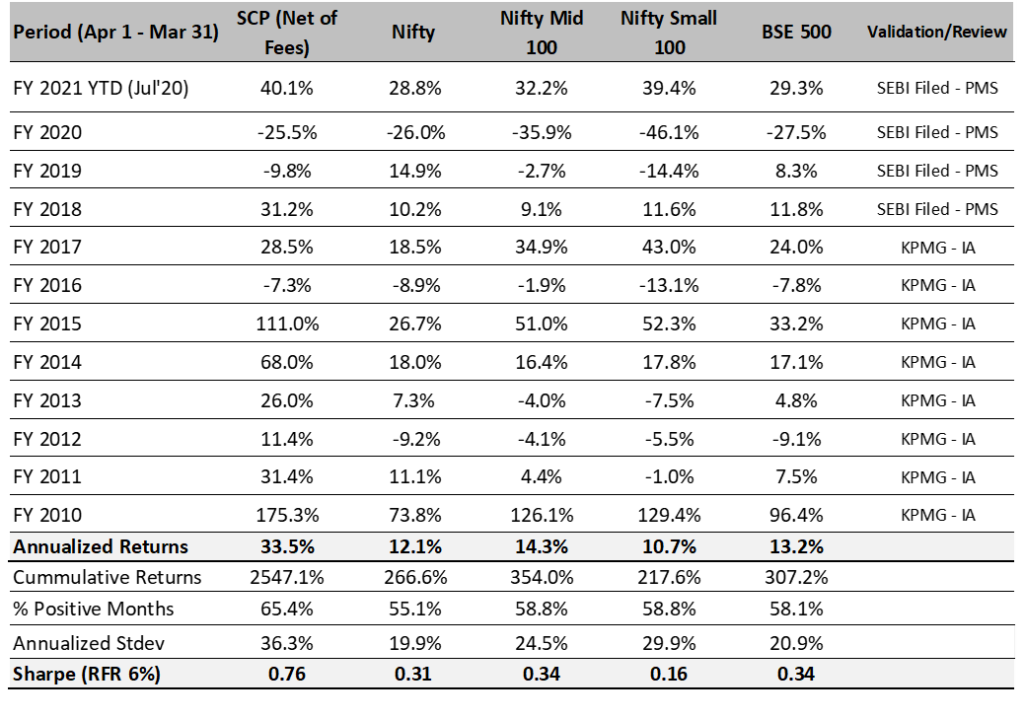
Source: SageOne Investment Advisors, Bloomberg, Wealth Spectrum
* SCP consists of 15 stocks as of Jul 31, 2020. Average Mcap 12,300 cr
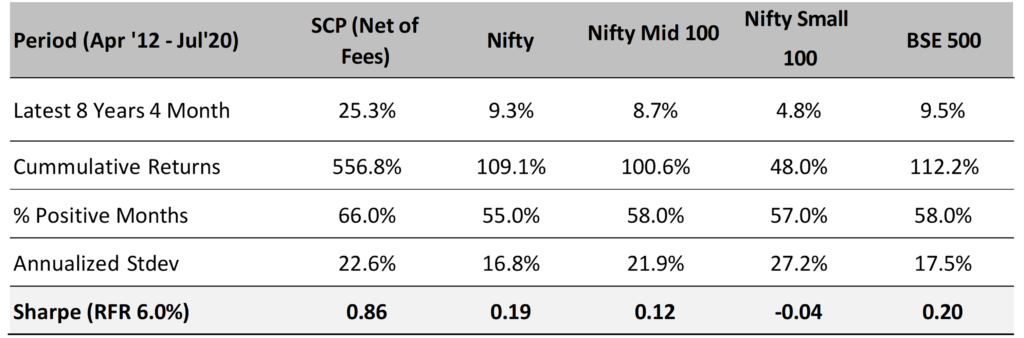
SCP: Latest 8 Years 4 Month Performance (Apr 2012 – Jul 2020)
SCP: First 3 Years Performance (Apr 2009 – Mar 2012)
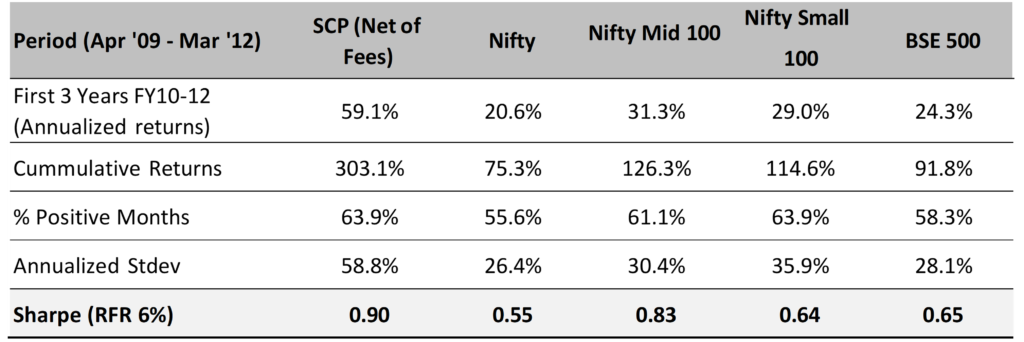
*We have consciously changed the composition of the core portfolio in terms of the average size of companies and the number of stocks in the portfolio after we started advising external clients in April 2012.
*The weighted average size of stocks at the start in FY10 was below $0.25 bn which has increased to nearly $1.64 bn by the end of Jul ’20. Also, the number of stocks has increased from 5 (+/- 2) in 2009 to 14 (+/- 2) during the past 8 years and 4 months.
* Reasonable diversification was done by design to improve liquidity and reduce volatility as a result of which annualized standard deviation has come down from 59% for the first 3 years to 22% during the last 8 years and 4 months.
Legal Information and Disclosures
Any performance related information provided above is not verified by SEBI.
This note expresses the views of the author as of the date indicated and such views are subject to changes without notice. SageOne has no duty or obligation to update the information contained herein. Further, SageOne makes no representation, and it should not be assumed, that past performance is an indication of future results.
This note is for educational purposes only and should not be used for any other purpose. The information contained herein does not constitute and should not be construed as an offering of advisory services or financial products. Certain information contained herein concerning economic/corporate trends and performance is based on or derived from independent third-party sources. SageOne believes that the sources from which such information has been obtained are reliable; however, it cannot guarantee the accuracy of such information or the assumptions on which such information is based.