
Dear Investors,
Indian markets continued their divergent performance between the large companies versus the small and mid-cap companies. While Nifty 50 index is down by almost 17% (as of Jan 10th) from the all-time high it hit in March 2015, during the same period BSE Mid-cap and Small-cap indices are down by less than 6% and 5% respectively. For CY2015 SageOne Core Portfolio (SCP) was up by 25.5% compared to Nifty 50, BSE Mid-cap, BSE Small-cap and BSE500 returning -4.1%, +7.4%, +6.8% and -0.8% respectively during the same period. Before I present my views on the current environment, let’s look at the performance of our core portfolio.
Portfolio Performance*
Below is the gross (pre-fees but excluding dividends) performance of our core portfolio in INR terms for the last 6.75 years. The first three years have been managing proprietary funds and the last 3.75 years have been advising external clients. Since clients have joined at various stages, individual performance may differ slightly based on the timing of purchases. For uniformity and ease we measure our performance using a “representative” portfolio (that resemble advice given to clients) and we call it SageOne Core Portfolio (SCP). SageOne core portfolio is not a dummy portfolio but the CIO’s actual total equity portfolio.
6.75 Years Performance (April 2009 – December 2015)
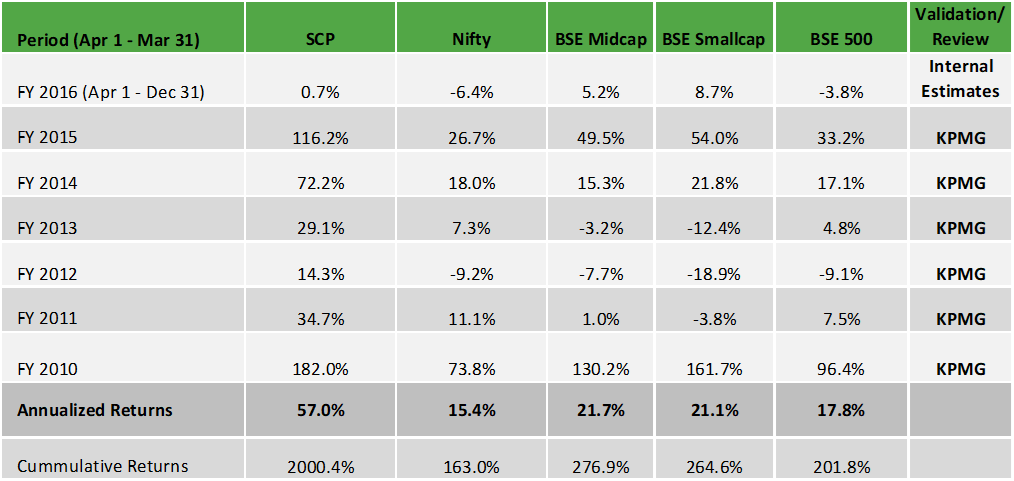
*Note: For detailed risk parameters and composition of the portfolio, please refer to the appendix at the end of this letter
Indian Market Performance since PM Modi Appointed as BJP Candidate
Stock returns since August ’13 have been broad based and indiscriminate
Major Indian indices are weighted by either their market cap or float. Investors’ allocation to a particular stock is not in proportion to the market capitalization of the company. When performance is skewed towards smaller capitalized stocks, indices don’t end up representing the returns many investors have made. Below graph will make it clear what I am trying to imply. In this table, I have tried to evaluate how stocks have performed since PM Modi was appointed the PM candidate for BJP’s election campaign starting September 2013. This is the performance from Aug 30, 2013 to Dec 31, 2015 a period of 28 months.
Performance of Top 1500 Companies Ranked by Market Capitalization (Aug’13 – Dec’15)
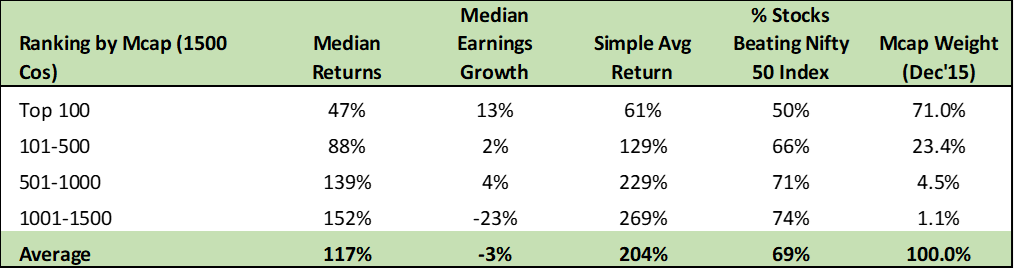
1500 companies cover practically the entire market capitalization ($1,500 bn) of the Indian stock market. It’s pretty evident from the above that the stock returns have been inversely proportional to the market capitalization of the companies. In addition they have been broad based i.e. almost 70% of the stocks have beaten Nifty index performance.
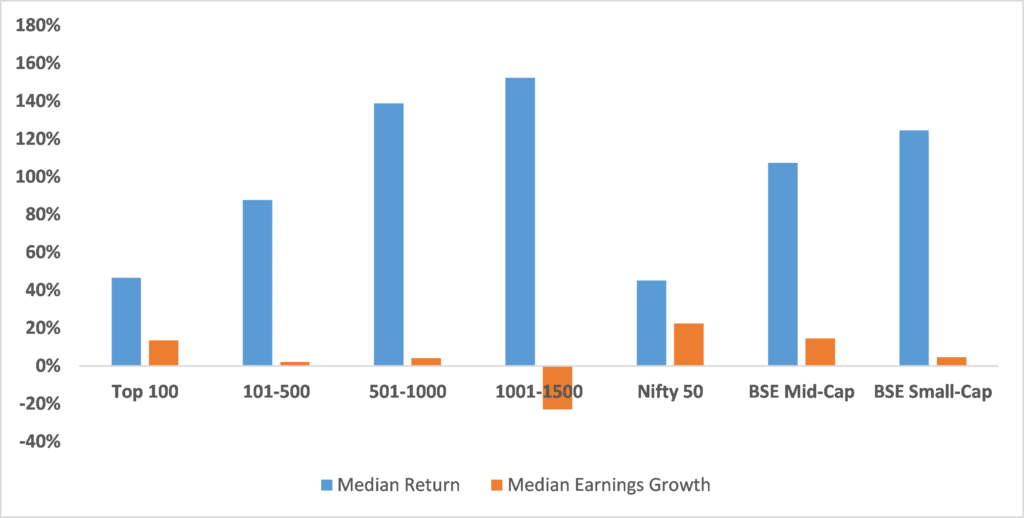
If you were to allocate your investments equally to the top 100 companies (by market cap on Aug 30, 2013), you would have returned 61% over the 28 month period. In contrast, if you had invested equally in the bottom 500 companies (1001-1500), you would have returned 269% i.e. more than 3.5x over the same period. This would have been fine if there were earnings to support such returns, but as you can see from the above table, the earnings (trailing twelve months, ttm) have fallen during this period for the bottom 500 companies. Please note that simple average as well as weighted average is impacted significantly by handful of companies. Hence I have used median earnings growth to provide a better representation of earnings movement. The below graph provides returns and earnings growth for the 1500 companies and for the major indices during the last 28 months.
Median Returns vs Median Earnings Growth
Returns can be misleading
Domestic retail investors tend to follow the returns. Real estate and gold were prime examples of such behavior during the last decade until 2013. Since then returns from those two asset classes have been stagnant and at the same time the returns from bank Fixed Deposits have been dropping, which has driven many to invest in the stock market. In addition, there has been a lot of excitement and expectations from the new government which has helped to improve sentiments significantly towards equities.
Last 28 months have rewarded one in proportion to the risk he/she has taken and very few have lost money given the broad based nature of stock returns. No wonder domestic institutional investors (DIIs) received more than $10 bn flow during calendar year 2015. Add to that the non-institutional domestic funds flow and the size gets significantly larger. As of Dec’15 top 500 companies account for 94% of the total market capitalization out of which top 100 is more than 71% (this was 80% in Aug’13). So imagine bottom 1000 companies having total market capitalization of 5.6% x 1500 = $ 84 bn. Out of this, promoter holdings is close to 60% and institutional and large investors make up another 25%, and one is left with 15% float i.e. $12.6 bn to buy from. Even if one was to add the midcaps ranked 101-500, we are talking of a float of less than $65 bn from 1400 companies and that too at today’s stock prices which are significantly above the levels seen at the start of the 28 months period. There is very little liquidity available to absorb the kind of flows that domestic institutional investors (DIIs) and other services such as portfolio management services (PMS) are getting. Results is sharp jumps in prices on a daily basis and unprecedented number of stocks hitting upper circuit.
Many fund managers have been claiming that they have beaten the indices and though it’s factually true, it hides one big parameter. “How much was the risk taken to get those returns”? In good times these facts are ignored by the investors and undue credit is taken by the fund manager.
How have the sectors performed relative to earnings?
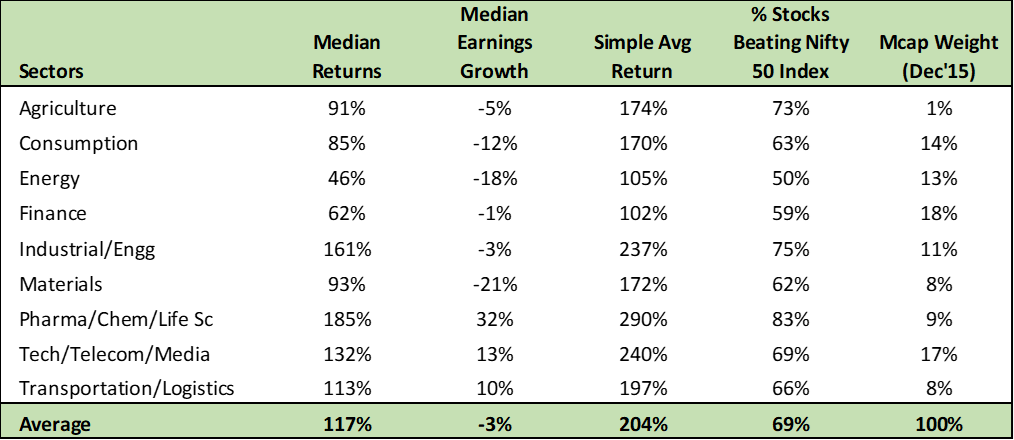
Returns have been across sectors, pharma been at the top and finance at the bottom. Note again that the returns are simple averages across stocks i.e. equally weighted returns.
Performance by Sector
Time to be extremely careful
If one is a bottoms up stock picker who does in-depth analysis before investing, this market hasn’t been for him/her. It’s been a market wherein you invest first and investigate later. If you spend couple of months analyzing a company and its competitors and the industry, more often than not the price runs against you and the valuations no longer remain compelling. Over the last 28 months because of the broad based nature of returns, many investors (especially in small/midcap stocks) have been extremely successful and that in turn provides false confidence not only in ones capabilities as an investor, but also to allocate more money into the same asset class. This continues until the prices stop rising and the trend reverses.
Inflow of funds have provided benefit of doubt to all kinds of companies irrespective of the business and management quality. Such stages are extremely risky and one needs to be extra careful. I believe that we are at the final stages of such broad based performance and market would no longer give benefit of doubt to undeserving companies. The risk return ratio is against you if one is betting on companies based on hope and without earnings growth support.
Situation on Ground
Over the past few months we have visited and met dozens of companies across broad spectrum of industries such as tires, plywood, chemicals, textiles, branded garments, textiles, cement, infrastructure, railways, automobile ancillaries, consumer discretionary, real estate developers, construction material, logistics, financials, pharma and agriculture. There was an overwhelming response from almost all companies except in couple of sectors such as road building and railways that demand situation on ground is very tough and there are no signs of any pick up. In addition niche export oriented companies focusing on the west and who are in a position to take away market share from Chinese companies are also doing well.
For companies in road building and railways there surely is order book growth, but whether this would result in sustainably profitable growth is a big question. For example, currently commodities and material used for road building is at depressed prices and the cost escalation clauses in many contracts is linked to the WPI. This could be a high risk against sustaining profits for companies who are bidding aggressively based on current low costs. Hopefully investors have learnt lessons from 2003-07 cycle to realize that high topline growth may not necessarily mean high bottom line growth especially in highly competitive sectors.
There is intense competition from Chinese imports in many sectors. Couple of examples are in on-road tires and vitrified ceramic tiles used for houses. Indian companies indicate that the cost of making tires in India are 25-30% higher than the selling prices for Chinese companies. Separately, tile companies indicated that they are disadvantaged by 50% compared to their Chinese counterparts. No wonder anti-dumping duty is been demanded by host of industries. The multiyear low shipping (sea based) cost when compared to land transportation cost in India isn’t helping either. One tile dealer based in Chennai informed that the cost of shipping tiles from China to the east coast of India is Rs. 4/sq ft (>10% of average selling price for the manufacturer). The same is double at Rs. 8/sq ft to ship from India’s west (Morbi in Gujarat) manufacturing zone to the east coast.
The Demand Scenario
As detailed in my last newsletter, growth is driven by four spending wheels viz. Government, corporates, domestic consumer and exports (global). With three wheels punctured, this time the onus of triggering the demand environment is majorly on the Government. With parliament blockages and fiscal deficit constraints even they are handicapped in the short to medium term.
Globally the central banks have been trying to induce demand by lowering interest rates. Low rates induce buyers to bring their buying forward. Low rates also increase asset prices thereby giving false feeling of wealth effect and increasing spending. Bringing forward of buying impacts future demand as there would be a period of adjustment. In China, to create employment the government has accelerated infrastructure spending to an extent never seen before. Increased capacity and focus on providing employment rather than profitability has created over supply of capacity and thereby goods. As Chinese companies dump excess goods at unreasonable prices, it transfers deflationary risk around the world thereby depressing the profitability of many industries. I have already cited couple of examples of industries impacted by this. Investors need to be cognizant of such macro environment impacting local companies
We are Cautiously Positive
We are cautious given the broad based run up in Indian stocks, but very positive on the structural changes being done and planned by the government. Programs such as Jan Dhan Yojana (National Mission for Financial Inclusion to ensure access to financial services for every Indian) and GST (goods and services tax bill) are structural in nature and would have huge implications on some industries. In this environment it’s critical to know what to avoid but equally important to carefully choose companies in niche sectors. It has taken much longer than we had initially thought for the government to implement reforms and structural changes, but we believe that India is at an inflection point and some companies would benefit disproportionately by the changes.
Patience and ground research is of utmost importance to catch the upcoming game changing trends. That’s the job of a long term investor and that’s what we intend to keep doing. If one is able to catch the right structural trend and identify appropriate investment themes, opportunity is tremendous. There are too many moving parts across the globe and too many disruptive forces around to destroy weak companies and industries. Add to that the valuation risk. It is not the time to bet on everything, but be extremely targeted and focused to identify massive India specific opportunities that are available at reasonable valuations.
Warm Regards,
Samit S. Vartak, CFA
Chief Investment Officer (CIO) and Partner
SageOne Investment Advisors LLP
For annexures, please download the PDF.
Legal Information and Disclosures
This note expresses the views of the author as of the date indicated and such views are subject to changes without notice. SageOne has no duty or obligation to update the information contained herein. Further, SageOne makes no representation, and it should not be assumed, that past performance is an indication of future results.
This note is for educational purposes only and should not be used for any other purpose. The information contained herein does not constitute and should not be construed as an offering of advisory services or financial products. Certain information contained herein concerning economic/corporate trends and performance is based on or derived from independent third-party sources. SageOne believes that the sources from which such information has been obtained are reliable; however, it cannot guarantee the accuracy of such information or the assumptions on which such information is based.