
Dear Investors,
Wish you a very happy new year! Let me take this moment to thank you for the trust you have shown in us over the past many years and we hope that we will be able to retain it forever and exceed your and our own high expectations.
In the newsletter of October 2015, I had provided my views on the valuation. Very little has changed since then and most of my views are still applicable. Given the government’s biggest strike on tax evasion and cash hoarding through the massive currency replacement step, I want to repeat the following paragraph I had written in the October 2015 newsletter:
“I have written very constructively on the Modi government in my last few newsletters and I am still as excited about the future of India under this new management over the long term. When the new management tries to change the corporate governance and the way capital is allocated (lesser subsidies and efficient capital expenditure) in such a complex country, it’s a fight against a system that has stabilized for many decades. The transition is going to be long and painful as creation and flow of unaccounted money is restricted. This unaccounted money which had very few investment avenues used to flow across India buying land or real estate, thereby providing not only cash but also giving a sense of wealth creation to the consumer as asset prices kept on ballooning. Now sudden break of this cycle is stopping cash flow as well as creating reverse of wealth effect impacting spending patterns. This is extremely positive structural development for India in the long run, but disruptive in the short to medium term. We have seen the drastic slowdown in consumer demand as a result.”
The latest development makes me even more positive on the future prospects of India’s economy and its growth in the long run. However, the transition will be even more painful for the markets as well as the country. Cleansing the system which was corrupted for decades won’t be so easy that things would normalize in a matter of few months or quarters. In this newsletter, I would provide my incremental views on valuation given this backdrop and also detail our portfolio positioning considering the expected environment. Before that, let us look at the core portfolio performance.
Portfolio Performance*
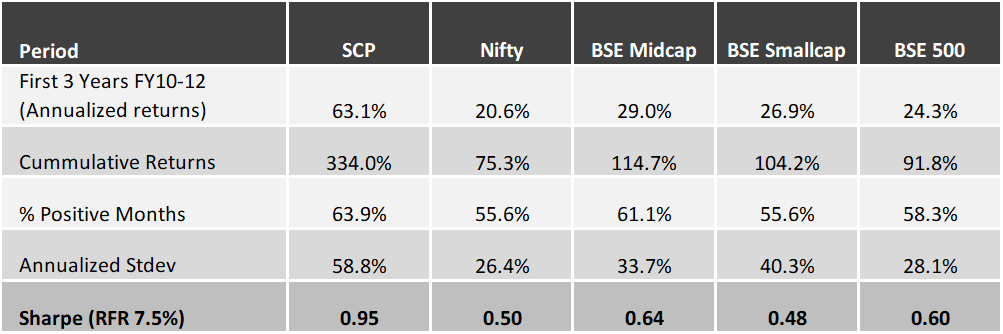
Below is the gross (pre-fees but excluding dividends) performance of our core portfolio in INR terms for the last 7 years and 9 months. For the first three years we managed proprietary funds and for the last 4 years and 9 months we have been advising external clients. Since clients have joined at various stages, individual performance may differ slightly based on the timing of purchases. For uniformity and ease we measure our performance using a “representative” portfolio (that resembles advice given to clients) and we call it SageOne Core Portfolio (SCP). SageOne core portfolio is not a dummy portfolio but the CIO’s actual total equity portfolio.
7 Years and 9 months Gross Performance in INR (April 2009 – December 2016)
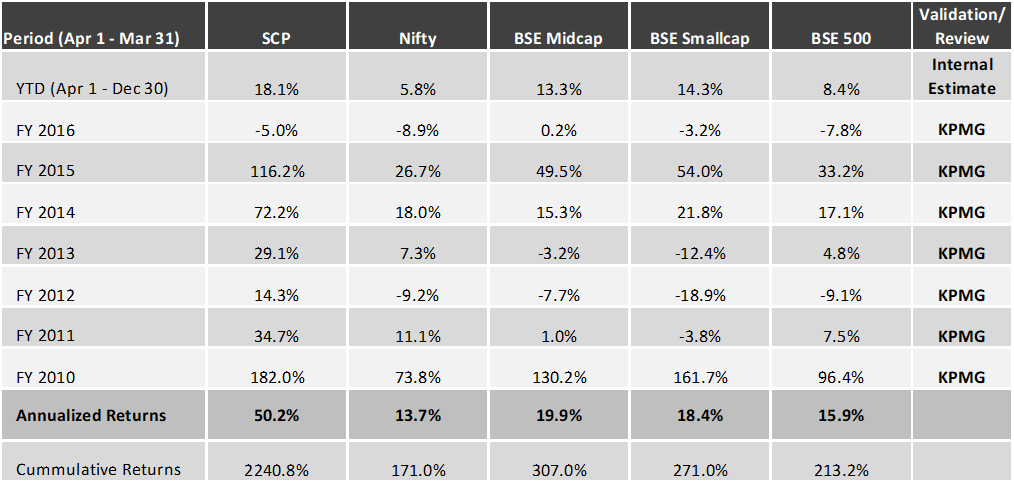
*Note: For detailed risk parameters and composition of the portfolio, please refer to the appendix at the end of this letter
View on Current Valuation for the Indian Stock Market
To start with, let me admit that even though I have done professional business valuation for many years, valuation in the stock market is a very different ball game. Here it entails some science, but a whole lot of art and when you talk of art, it involves a lot of subjectivity and with that a wide range of possibilities. So let me provide my “subjective” views on current valuations with support of few factual data points. Again to repeat, the views I had presented in October 2015 and January 2016 newsletters are still applicable as nothing significant has changed since then other than the increased uncertainty about the near term. Please do visit the ‘Newsletters and Presentations’ section of our website in case you are interested in reading those or you want to read the latest valuation study (see Appendix II at the end of this letter for a summary) released in November 2016.
Valuation Multiples Have Expanded in the Last Three Years without Earnings Support
If we analyze valuation levels since the peak of previous economic cycle in 2008, the rise in multiples started from the last part of 2013. During 2009 to 2013, valuations were reasonable in most of the sectors. Few anecdotal evidences are in NBFC sectors where many high quality companies were available at trailing P/B multiples of below 2x. If you compare now, those multiples have moved upwards of 3x and many above 4x. Similarly if you look at some of the branded building materials/commodities or quality auto ancillaries or specialty chemicals with ROE/ROCE > 20%, many were available at trailing PEx of at or below 20x. Now most of them are trading at multiples upwards of 30x. I can talk about many such sectors where in reality the growth has significantly gone down over the last 3 years but the multiples have expanded by 20% to well above 200%.
Let me substantiate the above with some statistics and evaluate how the entire market has done over the 3+ year period since PM Modi was selected the BJP candidate in September 2013. Even though I am picking just one starting point, valuations were similar or more attractive during most of the 2009 – 2013 period. If I were to analyze the performance (Aug 30, 2013 to Dec 16, 2016) of the roughly 1700 daily traded companies and rank them by market capitalization as of August 30, 2013 the picture looks as below. I have excluded the banks given that some of them have reported huge losses and they tend to skew the valuations.
Performance of Top 1654 Companies Ranked by Market Capitalization (Aug 30 ’13 – Dec 16 ’16)
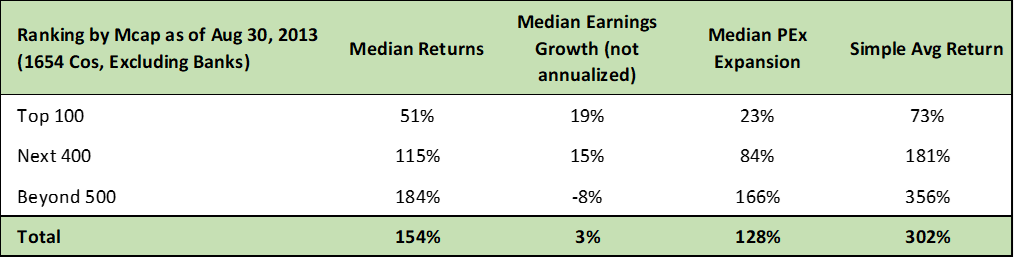
As you can see, the returns have been almost entirely because of PEx expansion and that is also inversely proportionate to the size of the companies. Worse is that the earnings growth has also been inversely proportionate to the returns. Simple average returns are stellar for small cap companies. If you had invested equally in the small cap companies beyond the top 500, you would have returned 356% (i.e. multiplied your investments by 4.56x), whereas if you had invested equally in the top 100 companies, the returns would have been only 73%.
Median Returns vs. Median Earnings Growth

Last 40 months have rewarded one in proportion to the risk he/she has taken and very few have lost money given the broad based nature of stock returns. Money follows returns and domestic money has followed the non-large cap stocks. Many domestic investors are first time investors in the stock market as returns from fixed deposits, real estate and gold have fallen and equity investment has caught the fancy. Many fund managers have been claiming that they have beaten the indices and though it’s factually true, it hides one big parameter. “How much was the risk taken to get those returns”? In good times these facts are ignored by the investors and undue credit is taken by the fund manager.
Risks to Current Valuation Levels
There are two key factors for stock values viz. earnings and PEx. Risk comes from either of the two contracting. Earnings contraction can occur due to topline de-growth or margin contraction. When margins reach peak levels during economic boom the risk of contraction increases from those elevated levels. Similarly PEx contraction risk increases the further it moves above the averages. Case in point are two extreme instances, first in Jan ’08 when PEx as well as margins were at historical highs and second in Mar ’03 when both were at near historical lows. Accordingly risks were the highest in Jan’08 and lowest in Mar ’03.
Net Margins and PEx History
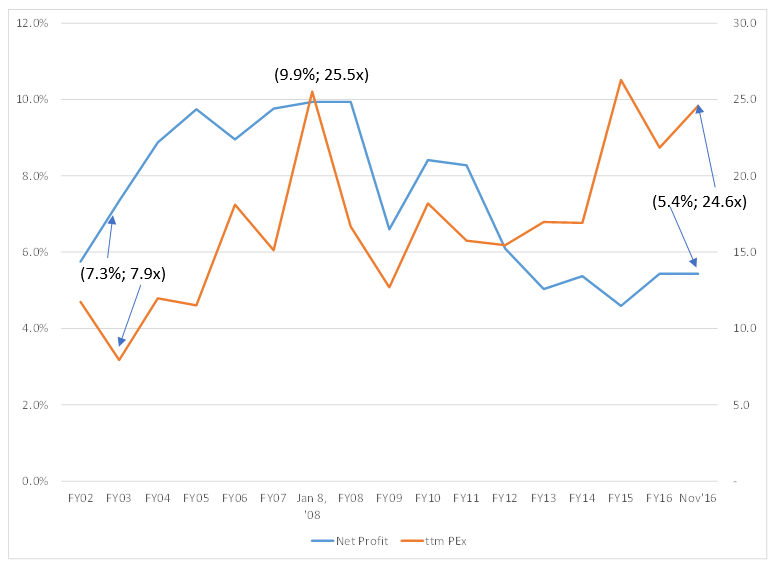
Source: AceEquity Database
As you can see in the above graph, currently the PEx is closer to the highs, but the margins are closer to the lows. Hence the risks are balanced given that possibility of PEx contraction can be counter balanced by either margin expansion or topline growth or both. We had seen the margins expanding over the last year (reaching 5.4% from trough of 4.6% reached in FY15) and gaining momentum in the first two quarters of FY17, but the currency replacement action has broken that momentum and has in fact increased the probability of margin contraction. Margins are vulnerable to increase in commodity prices (industrial metals, agriculture and energy) as well as operating deleverage from possible drop in capacity utilization.
Rise in Uncertainty
I believe that cash replacement is just the beginning of crackdown on unaccounted income/cash and many more steps would be needed to seriously reform the corrupt system. This backdrop and changing global scenario has increased the uncertainty for the markets. We need to closely watch for upcoming headwinds such as:
→ Increased focus on tax compliance would mean tax avoiding informal sector (accounting for 75% of employment in India) to shrink resulting in widespread job losses before the economy evolves a new ecosystem. Only fraction of these jobs would be absorbed by the formal sector.
→ In a weak demand environment, commodity prices (20-100% increase over last year in industrial metals and rubber) have jumped and in this environment the ability of companies to pass on the cost increase is limited. Low commodity prices had helped companies improve gross margins in the recent few quarters. There is risk of this benefit reversing.
→ In an evolving environment, companies would postpone their investment plans thereby slowing job growth. Capacity utilization has been near historical lows at around 70% and this had impacted investment cycle even before the recent disruption. Reduced money supply generally has negative multiplier effect on the growth.
→ Government seems to be serious in dealing with tax evaders and cash hoarders. Assets such as properties and gold were the hiding places for such wealth. With many having to pay significant taxes on hoarded cash and at the same time physical assets like properties loosing value, wealth of many would be destructed. This along with many having to face tax scrutiny may have negative wealth effect thereby impacting spending for some time.
→ GST rollout is also potentially disruptive in the initial phase. There will be de-stocking of the channel in many sectors where taxes are expected to drop. This will happen just before the implementation of GST and it may take time for many smaller companies to be ready with the backend needed to handle the new tax system, thereby delaying growth.
→ Globally, with new regime starting in the US there is huge uncertainty regarding trade policies that could disrupt global trade flow and force countries to evolve new models for growth.
Massive Opportunities Await in the Long Term
→ The incredible growth in cash component (30% CAGR vs. less than 14% CAGR in nominal GDP) during this century had inflationary effect on many hard assets such as land and property. Inflation also kept the interest rates elevated. Both these have acted as added cost burden on companies who want to invest thereby impacting capital expansion and employment growth.
• With government’s intention to reform the cash economy, the hope is that land/property prices would come down significantly
• GST roll out is expected to make India a uniform market without state border bottlenecks in terms of time and cost
Above two are the biggest reforms in India’s modern history and have the potential to make India extremely competitive in the global manufacturing chain and help create global scale businesses.
• With transfer of wealth from informal to formal economy, government tax collections would significantly improve and if they allocate that capital efficiently (subsidy, infrastructure spend) India could transition into a much higher growth trajectory.
• Formal and transparent business practices would incentivize foreign investments and boost capital expenditure thereby employment growth.
Conclusion on Valuation
Valuations in the non-large cap stocks are discounting a lot of hope. I believe that the uncertainties have increased over the past two months and resultantly the re-start of growth phase for corporates is pushed out. In such environment, there is risk of not only multiples but also earnings contracting. It is time to be extremely careful in picking the right businesses and absolutely not the time to overpay. We have to be open to the possibility that sometimes what’s good for the country and overall population may not necessarily be rewarding for the stock market. Historically we have seen best of market returns under worst of governments and vice versa.
Our Portfolio Positioning
With uncertainties over the next few quarters significantly outweighing the long term benefits, we have become increasingly uncomfortable with valuations in some of our investments in sectors related to domestic consumption and finance. Hence we have either reduced allocation or completely exited some of them. With these changes we currently hold around 25% liquidity in our portfolio. We believe that the disruption caused by the currency replacement step would be significant in some of the sectors, including ones which we like for the long term. This will potentially provide attractive entry points in some businesses we love but were unable to invest earlier solely due to discomfort on valuation. In addition to liquidity being a strategic position, the level is also high (compared to our historical levels) as it has been difficult to find many attractive opportunities wherein the risk reward is in our favor to deploy this cash.
We believe that it’s time to keep your shopping list ready and patiently wait for the valuation levels to reach ones comfort level. We have our shopping list ready in sectors where fear of disruption is the highest, but they are the net gainers over the long term.
Macros are very difficult to predict or bet on for bottoms up investors like us. Many of the risks/rewards we discussed in this letter may or may not play out and we are very aware of what we can’t know. We can only evaluate opportunities offered to us by the market and decide if we agree upon the price offered.
Warm Regards,
Samit S. Vartak, CFA
Chief Investment Officer (CIO) and Partner
SageOne Investment Advisors LLP
Email:sv@SageOneInvestments.com
Website:www.SageOneInvestments.com

*SageOne Investment Advisors LLP is registered as an Investment Advisor with SEBI.
Appendix I – Detailed Performance Evaluation
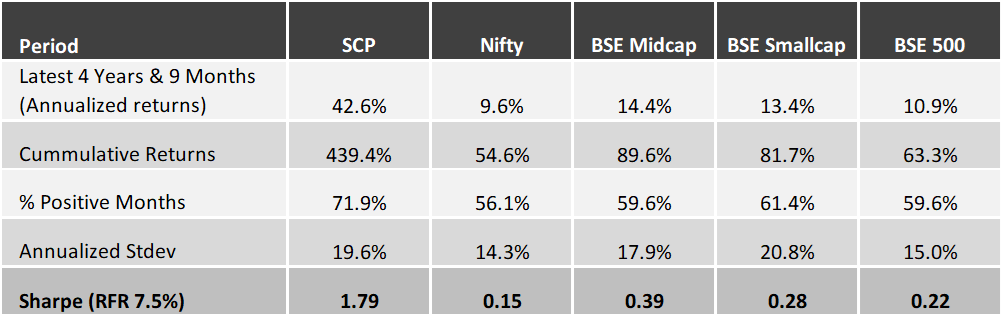
*We have consciously changed the composition of the core portfolio in terms of the average size of companies and the number of stocks in the portfolio after we started advising external clients in April 2012.
*The weighted average size of stocks at the start in FY10 was below $0.25 bn which has increased to near $1.3 bn by the end of Dec ’16. Also, the number of stocks has increased from 5 (+/- 2) in 2009 to 14 (+/- 2) during the past 4 years.
*Reasonable diversification was done by design to improve liquidity and reduce volatility as a result of which annualized standard deviation has come down from 59% for the first 3 years to 20% during the last 4 years and 9 months.
Latest 4 Years 9 Months Performance (April 2012 – Dec 2016)
First 3 Years Performance (April 2009 – March 2012)
Appendix II
India’s Sectoral Valuation Study: Historical Absolute Levels vs. Normalized Levels
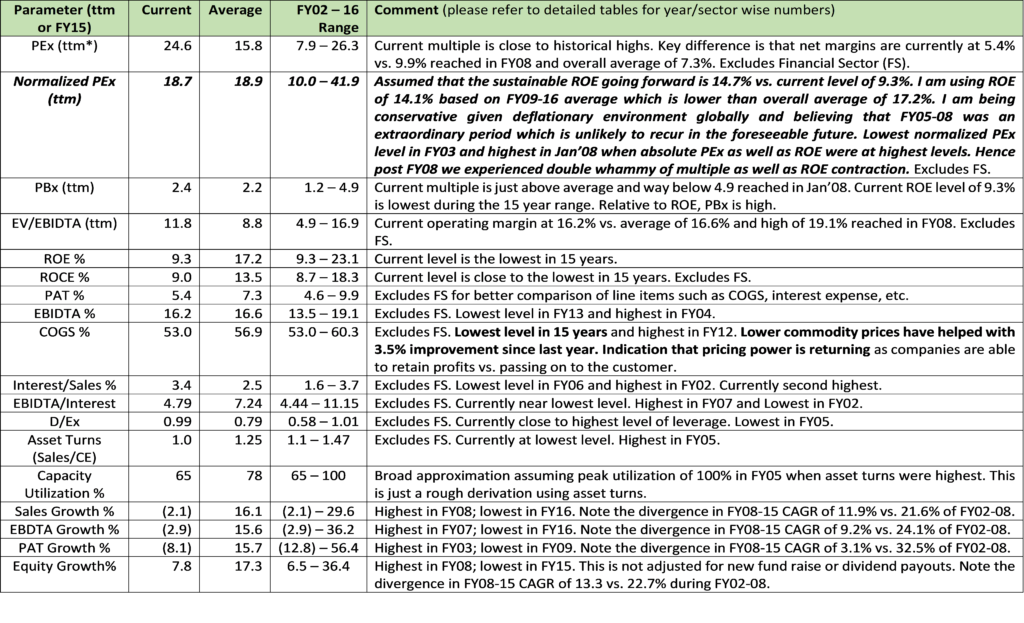
This report analyses how India’s current absolute valuations stack up against the last 15 years of history. Straight forward valuation multiples can be deceiving and may entice you in or keep you out of the markets at wrong times. To take care of this issue I have recalculated current as well as historical valuations by assuming normalized (or sustainable) profitability across all years. This is done at sectoral level so that we might observe the extent of relative over/under valuation and make some intelligent choices for portfolio positioning going forward. Risk with normalization is that the timing for the profitability to revert to sustainable level is uncertain. The longer it takes to revert, the higher would be the risk to valuation in situations when absolute valuations are high.
Total Universe: The starting universe for this analysis comprises all the companies (872) in the BSE 500, BSE Midcap and BSE Small Cap indices. After excluding companies who do not have 15 years of listed history, we are left with 557 companies. This universe covers about 80% (US$1.2 trillion) of the total listed current market capitalization. The chosen period FY02 – 16 covers years between two troughs in India’s economic cycle (not stock market cycles) and I believe covers a wide range of business environments representative of average conditions.
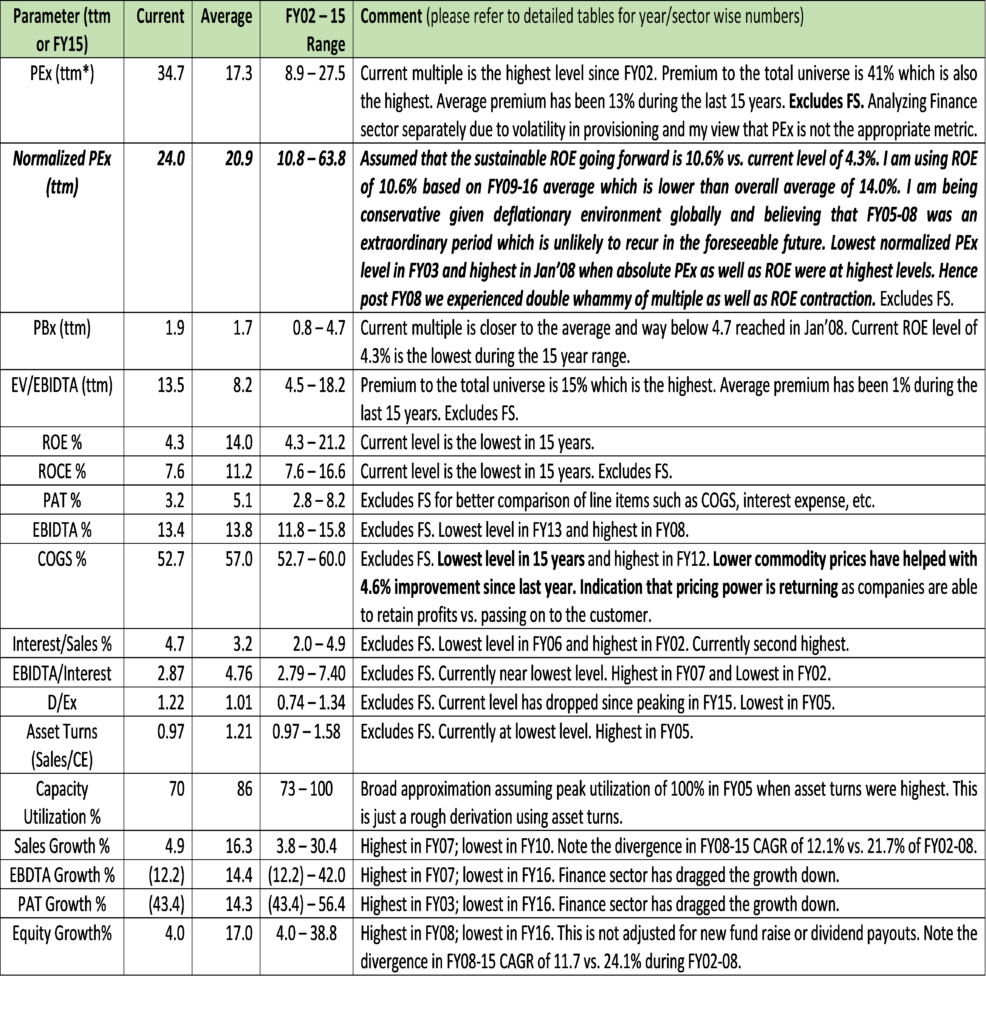
Mid/Small Cap Universe: The valuation as well as other parameters are weighted averages and hence are significantly influenced by large companies. To remove this effect, in addition to presenting the outcomes for all the 557 companies, I am also presenting similar analysis for non-large cap companies. This is done by excluding not only the top 10% of the largest companies but also removing outliers such as Suzlon, Jet Airways, Piramal Enterprises and Tata Steel who have had abnormally large one-off profits/losses skewing overall valuations. Post these exclusions, we are left with 496 companies totaling US$389 bn ($20 mn to $4.7 bn range) of market capitalization.
Same analysis is done for the Total and Mid/Small Cap Universes and hence you would find two sets of tables. First the summary tables are presented for both followed by detailed tables.
Please visit our website for detailed report.
SUMMARY FOR TOTAL UNIVERSE
SUMMARY FOR MID/SMALL UNIVERSE
Legal Information and Disclosures
This note expresses the views of the author as of the date indicated and such views are subject to changes without notice. SageOne has no duty or obligation to update the information contained herein. Further, SageOne makes no representation, and it should not be assumed, that past performance is an indication of future results.
This note is for educational purposes only and should not be used for any other purpose. The information contained herein does not constitute and should not be construed as an offering of advisory services or financial products. Certain information contained herein concerning economic/corporate trends and performance is based on or derived from independent third-party sources. SageOne believes that the sources from which such information has been obtained are reliable; however, it cannot guarantee the accuracy of such information or the assumptions on which such information is based.