
Dear Investors,
Last year and a half have been extremely volatile and difficult for most investors in the Indian markets irrespective of what the headline indices depict. For FY19, we were down 3-8% across the two portfolios. This is the second time in the last 10 years that we have had negative returns and each time it’s been extremely disappointing. The only parameter that provided us some solace was a 20%+ YoY earnings growth for both our portfolios.
Our fund raise activities have been carefully timed along with onboarding the right set of investors who understand the risks of investing in the volatile Indian equity markets. We experienced the quality of our investors during this tough period with their sophisticated, mature, and calm reaction to the volatility in the markets. It was the support of our existing investors that enabled us to raise more than double the funds in this round as compared to the bullish 2017 raise (new subscriptions remained closed from Oct’17 to Jun’18). More importantly, the existing investors topping up was a big portion of the incremental fund flow.
I would like to take this opportunity to thank each one of you for maintaining your faith in us and for the positive word of mouth even during the times when we were underperforming the main indices. Our external funds under management and advisory have grown from INR 1.5 cr in 2012 to nearly INR 1,000 cr now, but we don’t consider this as an achievement to be proud of. We will be proud only when, for the next 5 years we continue delivering returns for all investors that are well beyond our own high expectations and the overall Indian market.
We cannot guarantee returns, but we can assure you that we will not compromise on our intent and efforts in finding the best investment opportunities for all of us. We may make some mistakes on the way but hope to make significantly more successful investments. Wealth generation for myself will never be the focus. On the integrity front, we will never compromise on any aspect of the business and you should keep extremely high expectations of us. If there is ever any doubt in your mind about the integrity of this institution, please voice your concerns immediately and directly to me.
In this memo, I am presenting an analysis that I think is important for all investors to be aware of and be ready for, as such patterns will repeat more often in the future. I will also provide our broad strategy and positioning post elections, especially given that the Modi government has received a strong mandate for the next 5 years.
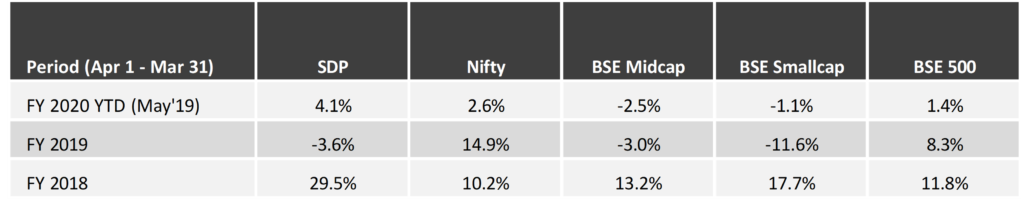
*Note: Our detailed portfolio performance is presented in the Appendices at the end
Volatility: Test of Conviction
Indian markets have always been relatively illiquid and more so for non-large cap companies. Volatility can play with the sentiments of investors and force them to act exactly against their own long term interests. Rising stock price can blind the investor and instill false confidence in the business, while falling stock price can completely shatter confidence and conviction in a business inducing further volatility in prices. The last year and a half has been brutal in this respect for small and midcap companies on the downside when large caps kept marching ahead.
Regulations (SEBI re-categorization for mutual funds) may have triggered initial rotation from small/midcaps to large caps, but the falling prices created their own snowball effect. I have observed stocks falling 30-40% simply because a fund holding 3-4% decided to exit the stock. In effect one fund manager’s decision to exit, sentimentally forced many weak investors to exit for no fundamental reasons of their own. The instant dissemination of news/data/analysis through social media has added fuel to the greed/fear psychosis and investors are increasingly tending towards quickly pulling the buy/sell trigger.
Indian Market Structure
Before I present the analysis that might help understand why I believe that the non-large cap universe will go through (more often) periods of extreme valuations on both sides, let me provide the basic distribution and structure of the listed space in terms of ownership and market capitalization (Mcap).
Distribution of Ownership and Mcap for the Top 1500 Regularly Traded Companies
(As of June 7, 2019)
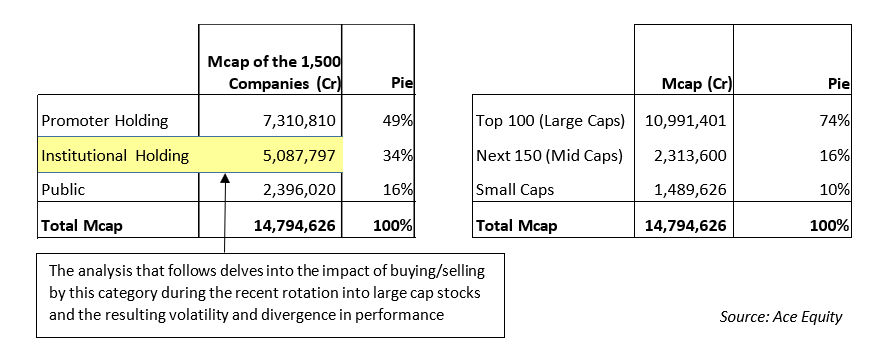
The following tables show how skewed the Institutional (Domestic & Foreign) Holding has become and how exaggerated has the impact been on stock prices because of net buying/selling by the institutions. This effect is more pronounced in the bottom 1,250 companies of the top 1500. The value of institutional holding in these 1,250 companies dropped by INR 1.84 Lac Cr from INR 4.7 Lac Cr (as of Dec’17) to 2.9 Lac Cr (as of Jun’19) when the net selling by the institutions was less than INR 12K Cr. This is around 15x impact. Currently, 55% of the institutional holding is in the top 20 stocks and only 1% in the bottom 1000 stocks (501st – 1500th). Even if 1 or 2% from the top 20 institutional holding has to move back in the small cap space, the impact cost could be very high. As you can see from the bottom small tables (Split) that you don’t need huge capital (net buying) to do so. In recent times, when we try buying less than 0.5% stake in companies the impact cost is more than 10%. When buying returns in this space, it won’t be across the universe but will be focused on the quality companies which are less than 15% of the universe. This will exaggerate the movements further.
Rotation/Change in Institutional Holding from Dec 31, 2017 to Jun 7, 2019
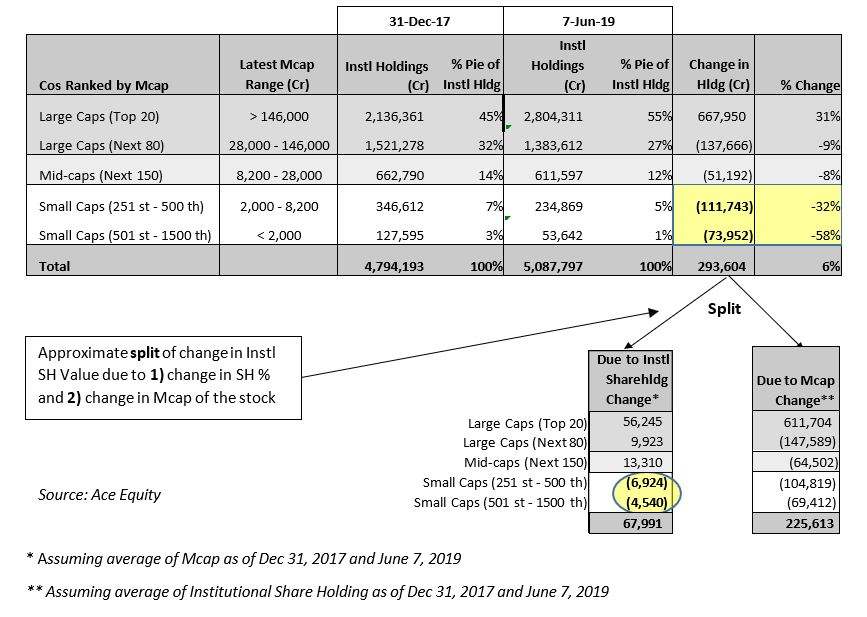
Other observations from the above tables and input data:
→ Today, 41% of the total institutional shareholding (SH) in the Indian stock market is in the top 10 stocks and 55% in the top 20 stocks. These numbers were 32% and 45% as of Dec 31, 2017.
→ Compared to the above, Institutional SH is only 6% in the entire small cap space (251st to 1500th stock). This was 10% in Dec’17.
→ Institutional SH value has increased by INR 6.7 lac crores in the top 20 largest stocks, while it has fallen by INR 3.7 lac crores in the rest of the Indian listed universe since Dec 31, 2017.
→ Beyond midcaps (251st stock and beyond), the destruction in institutional SH value since Dec’17 has been INR 1.85 lac crores triggered by net selling of just INR 11.5K crores. Though the net exit is based on rough estimates, the snowball effect is undeniable at > 15x.
→ The institutional SH value in the 1000 stocks beyond top 500 is just INR 53.6K cr. Top 20 has more than 52x of this. The same multiple used to be 16x as of Dec 31, 2017.
→ Institutional SH is concentrated at more than 82% in the top 100 stocks today
→ The institutional SH value has crashed by 58% for 1000 stock universe (501st to 1500th company) and by 32% for the 250 stock universe (251st to 500th company) in the small cap universe. This is exceptional considering that overall institutional SH value has increased.
Divergence in performance between large and small caps
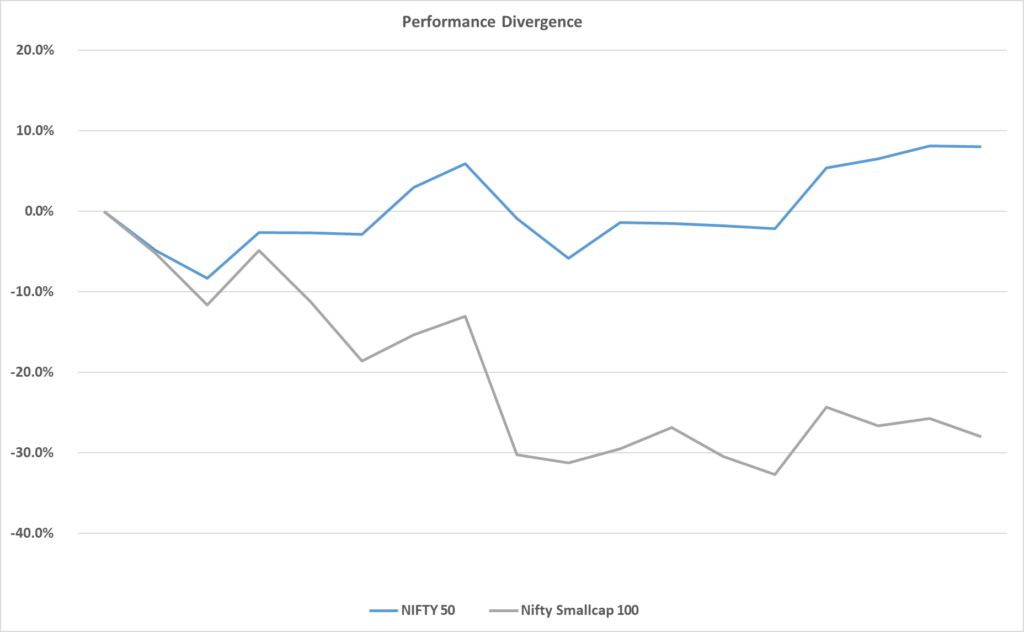
Source: Ace Equity
Note: Valuation analysis was presented in our Jan’19 memo and hence not repeating it.
Investors tend to be late to the party as they feel that the safest time to invest is when everyone around them is also invested/investing in the same asset class. In the second half of 2017, when small/midcaps were doing well and there were positive sentiments around them, investors felt the safest investing in this asset class. Those who invested in that category late in the cycle are sitting on significant loses. In reality, the safer one feels the riskier is the time to start investing. This cycle has repeated frequently and not limited to just bubbles such as 1999 or 2007. Money rushing in at wrong times is the reason the weighted average returns of investors are extremely poor (wrote about Morningstar study in my previous memo) compared to the indices which are time weighted.
“Recency Bias” a Wealth Destructor
Recency bias is a bias in Behavioral Finance that can cloud an investors’ judgment. There is a tendency to think that what’s been happening lately will continue happening. Recency Bias can cause investors to stay in stocks because they have been performing well, despite warning signs such as high valuations. The bias can conversely keep investors from buying when stock prices are low, because for months stocks had been falling and investors expect that to continue.
Different sections of the market, as presented in the analysis, are going through such phenomenon currently and unfortunately investors will increasingly herd into the segment that has been doing well in the recent past.
Current Investment Opportunity
As is prudently said, one should start a business in a tough environment because if it does well in such times, it surely would survive and do well when the environment improves. I believe that today is such an environment to pick businesses. This decade has been extremely difficult for the Indian corporates in terms of earnings growth and demand environment. The earnings growth rate (CAGR) for the Indian listed companies has been 2.4% over this decade and NIL over the last 5 years. If I were to exclude the banks (given exceptional provisions) and few companies with large exceptional losses, the profit growth rises to 6.5% over this decade and to 7.0% over the last 5 years. This barely covers inflation and hence the earnings growth in real terms has been dismal.
As an investor, it may seem very difficult to build a portfolio in such weak times, but it’s a great opportunity to pick businesses that have differentiated themselves against the competition and have come out stronger after a tough cycle. You get these great businesses at reasonable valuations and if the economy picks up, they will do exceedingly well. Bull cycle is the worst time to build a portfolio as everything seems good and you end up filling it up by going lower down the quality curve as valuations seem cheaper there. Today you are able to get reasonable to cheap valuations in high quality businesses if you look away from the top 20 stocks and popular consumer stocks that dominate the major indices.
Considering that our nominal GDP growth rate has been around 12-13% during this past decade, the earnings growth rate has been surprisingly weak. Net profit margins (after above exclusions) have contracted sharply from above 9% at the start of this decade to just around 6% today. In the long run, our earnings growth has averaged closer to the nominal GDP growth rate and I won’t be surprised if the earnings growth rate going forward is significantly higher than the recent past to revert the averages to the 12-13% range.
Next 5 Years
The BJP government has recently received a clean and strong mandate for the next five years. During the first five years, they took a few difficult steps in cleaning up and preparing a strong base which they can build upon in this term. I believe that the next five years are going to be better than the previous five years in terms of earnings performance.
Investors need to be aware of the risks and not go blindly after the entire universe expecting higher “Beta” just because PM Modi came back. It’s important to be very picky in selecting businesses and go after the ones with visibility in earnings growth. It’s very important to stay away from hope trades. During the honeymoon phase of the government you will hear a lot of exciting announcements and capex plans. Very rarely do such things play out in terms of investment success in the short run; we have seen how GST unorganized to organized investment theme has panned out so far. Bottom-line for investment is the earnings growth and in its absence, stock levels won’t sustain. My advice would be to not pre-empt the theme. Better to be late vs getting it wrong and being stuck for years.
Warm Regards,
Samit S. Vartak, CFA
Founder and Chief Investment Officer (CIO)
SageOne Investment Advisors LLP
Email: ir@SageOneInvestments.com
Website: www.SageOneInvestments.com

*SageOne Investment Advisors LLP is registered as an Investment Advisor and PMS with SEBI.
Appendices
PMS Portfolio* Performance (Net of Fees)
* PMS portfolio is composed of 20 equal weighted stocks. Details of SCP are given below.
Investment Advisory Core Portfolio Performance (Gross Before Fees)
Below is the gross (pre-fees but excluding dividends) performance of our core portfolio in INR for the last 10 years and 2 months. For the first three years, we managed proprietary funds and for the last 7 years and 2 months, we have been advising external clients. Since clients have joined at various stages, individual performance may differ slightly based on the timing of purchases. For uniformity and ease, we measure our performance using a “representative” portfolio (that resembles advice given to clients) and we call it SageOne Core Portfolio (SCP). SageOne core portfolio is not a dummy portfolio but the CIO’s actual total equity portfolio. The representative portfolio until FY17 was reviewed by KPMG. Post that the performance is for the PMS scheme.
10 Years 2 Month Performance in INR (Apr 2009 – May 2019)
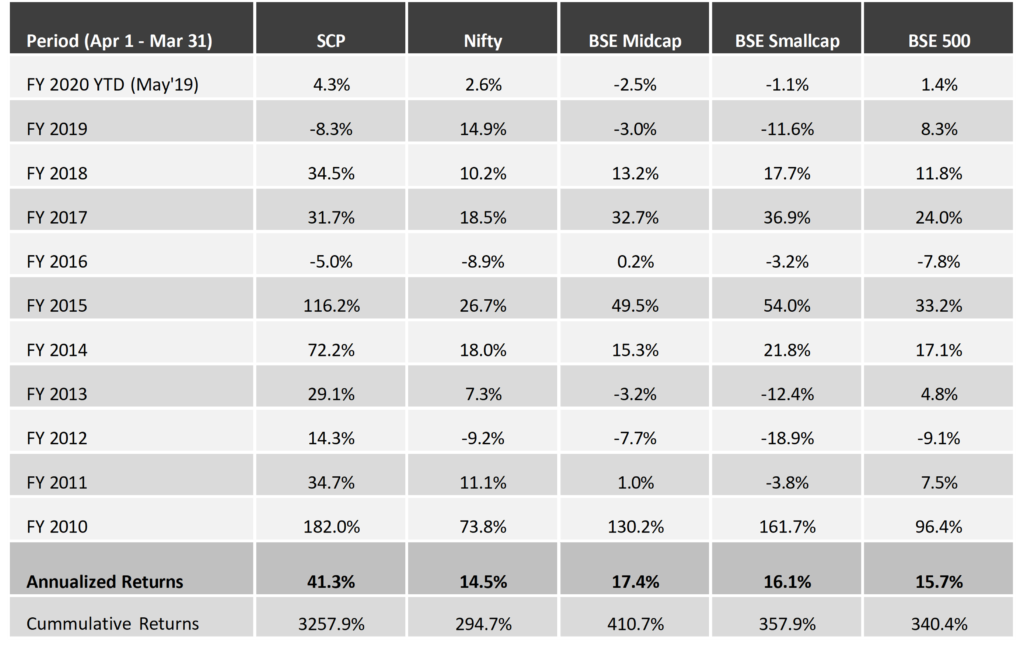
* SCP consists of 14 stocks as of May 31, 2019. Investment Advisory and large PMS clients are advised this portfolio.
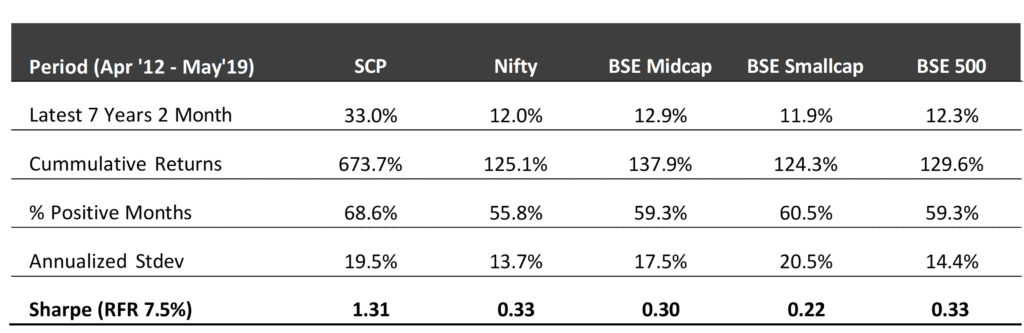
Core Portfolio: Latest 7 Years 2 Months Performance (Apr 2012 – May 2019)
First 3 Years Performance (Apr 2009 – Mar 2012)
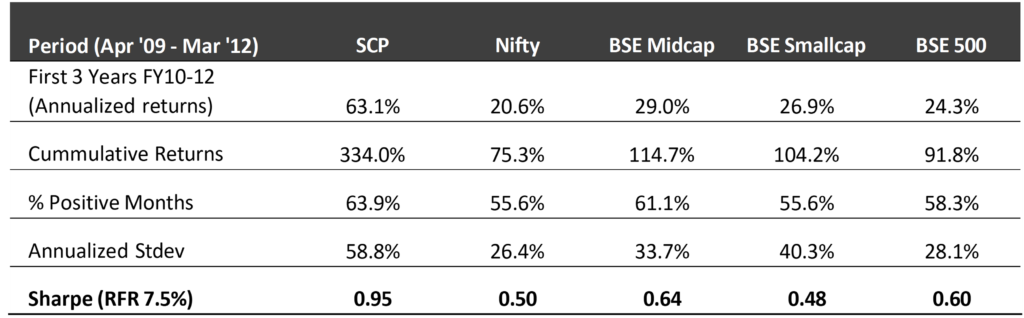
*We have consciously changed the composition of the core portfolio in terms of the average size of companies and the number of stocks in the portfolio after we started advising external clients in April 2012.
*The weighted average size of stocks at the start in FY10 was below $0.25 bn which has increased to nearly $1.3 bn by the end of Dec ’18. Also, the number of stocks has increased from 5 (+/- 2) in 2009 to 14 (+/- 2) during the past 6 years and 6 months.
*Reasonable diversification was done by design to improve liquidity and reduce volatility as a result of which annualized stand
Legal Information and Disclosures
This note expresses the views of the author as of the date indicated and such views are subject to changes without notice. SageOne has no duty or obligation to update the information contained herein. Further, SageOne makes no representation, and it should not be assumed, that past performance is an indication of future results.
This note is for educational purposes only and should not be used for any other purpose. The information contained herein does not constitute and should not be construed as an offering of advisory services or financial products. Certain information contained herein concerning economic/corporate trends and performance is based on or derived from independent third-party sources. SageOne believes that the sources from which such information has been obtained are reliable; however, it cannot guarantee the accuracy of such information or the assumptions on which such information is based.