
Dear Investors,
This year, the Indian markets have seen massive outperformance of large cap indices (e.g. Nifty 50) against the broader universe. In addition, even within the large cap universe, the expensively valued consumer oriented sectors and the export (or import substitute) oriented IT and Oil sectors have dominated the Nifty 50. The indices being market cap (of float) weighted further skews the performance. The following table illustrates the skewness:
Performance of the top 1000 stocks Ranked by Market Cap (CY2018 – until Sept’18)
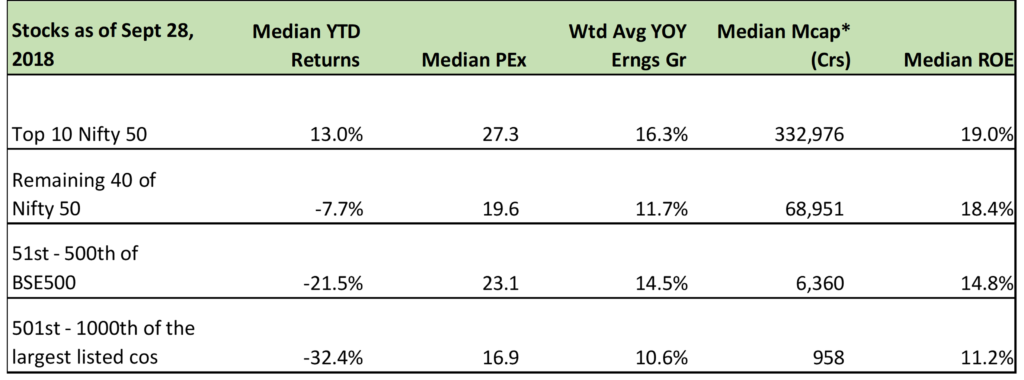
The Nifty 50 in CY 2018 is up 3.8% but you can see how concentrated the returns are. The returns this year have been directly proportional to the market cap, which is the exact opposite to what happened in 2017. The table (for BSE 500 companies then) I had presented in the January 2018 memo is worth reproducing as this shows how mean reversion in stock market works so often and so ferociously. In the short run there is very little correlation between earnings growth and returns, but in the long run they converge.
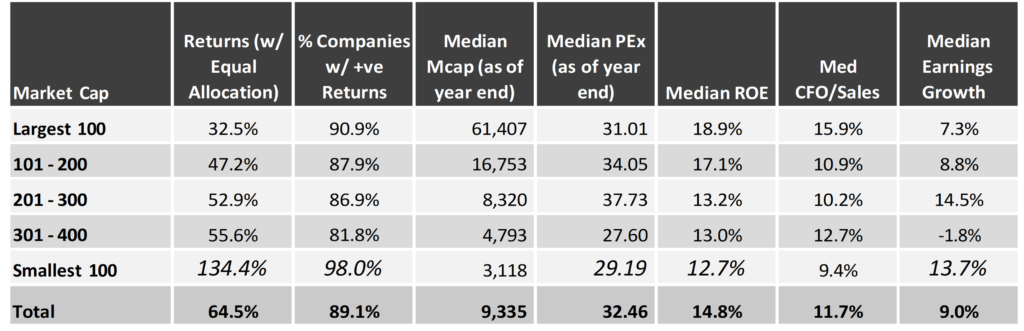
Performance of BSE 500 Companies in CY 2017
*Note: Our detailed portfolio performance is presented in the Appendices at the end
Whenever you experience such wide outperformance, you wonder if such simple strategies (1. expensive and consumer-oriented high-quality companies and 2. Defensive/export- oriented large cap) should be followed rather than toiling year round trying to find emerging great businesses. In this memo, I plan to provide my views on the strategies that have outperformed in the recent past and then detail our strategy and portfolio positioning in the current extremely volatile environment.
While different investment strategies may work over different periods of time, no investment strategy will work across all time periods. We have seen how investor risk appetite works in cycles and that makes Investment strategies cyclical too. Last year saw investors disregarding risk and enhancing returns by taking higher risk. I had showcased in the January memo how valuations for non-large caps had reached unprecedented levels well beyond the January 2008 peak levels. Valuations are cyclical too (mean reversion applies), and they revert because of reasons that are completely unpredictable. This year we saw some such reasons which were regulatory in nature:
1) SEBI circular re-categorizing mutual funds, which has resulted in many funds being forced to sell mid and small cap stocks to meet targeted allocation to large cap stocks (largest 100 listed companies only).
2) The ASM (“Additional Surveillance Measures”) list that the exchanges come out with triggered margin calls for investors using them as collateral. This forced further selling in mid and small cap stocks.
3) Increase in margins required by the exchanges, which again forced selling.
This was accompanied and followed by macro worries from increasing oil prices, depreciating rupee (12% depreciation vs USD in 2018), rising yields, upcoming elections, global trade war and many more. Add to this some high profile corporate frauds and auditor resignations which saw stocks crashing by 30-70% in a day. If that wasn’t enough to scare investors, came the latest fear that IL&FS (a government controlled large infrastructure finance institution) could be facing liquidity risk which further pushed the yields up especially for wholesale borrowers.
The result of all this has been a widespread and big drop in prices of stocks. The median fall in the top 1000 stocks from their 52-week high has been more than 40%. Just in the month of September the various mid and small cap indices have fallen by 12 to 19%, which is comparable to the worst month during the 2008 financial crisis (Lehman collapse in September 2008). Most investors have lost the entire profit made in 2017 and beyond.
In the meantime, even though overall foreign fund flow in equities continued to be negative, inflow by domestic institutions and ETFs (low fee passive investments preferred by foreign funds to get India exposure) continued to be positive. Majority of this again has been to large cap stocks that has aided outperformance.
Investment strategy based on funds Flow
Huge divergences that we have seen in the recent years challenge ones investment strategy to the core. Today, many investors discuss funds flow more than businesses and have started differentiating between large cap and mid-small cap investing. These divergences are easy to explain with the benefit of hindsight, but difficult to predict. The real problem is when investors try and jump ship, and that too very late in the cycle. Investors tend to follow performance and that is the reason most underperform the indices in the long run. In 2017, investors flocked into the mid-small cap space and now they are going the other way.
David F. Swensen, who is the CIO of Yale’s Endowment Fund and one of the most respected investment geniuses in the professional investment management community, observed the following in his book, Pioneering Portfolio Management: An Unconventional Approach to Institutional Investment –
“Far from exhibiting the courage required to take contrarian stands, most investors follow the crowd down the path to comfortable mediocrity. Investor cash flow into and out of actively managed funds provide a case in point. Ideally, serious investors would provide funds to managers after a period of understandable underperformance and before a period of expected outperformance. In fact, investors consistently do the opposite.”
The Morningstar study indicates that individual investors exhibit return-damaging, performance-chasing behavior with remarkable consistency. In a ten year study done in 2005, some funds showed a stunning 13.4% per year gap between reported results (time-weighted) and actual investor returns (capital-weighted).
Unfortunately, this will continue as investors will follow the outperformance and overweight their allocation to the short term performers. In addition the outperformance will be used as a sales tool by the army of financial advisors to sell them the best performed product. Crowded spaces are always most comfortable for most sellers as well as buyers. This is the reason uptrends as well as down trends overshoot.
Is this outperformance sustainable?
This year, Nifty 50 performance is dominated by 3 of the top 10 largest stocks viz. TCS, Reliance Industries and Infosys, with average returns of 46% during the first 9 months of 2018. The earnings growth during this period has been in single digits, meaning that most of the returns are due to the rerating of valuations. This is similar to what happened in the mid- small cap space in 2017. It is not difficult to predict the sustainability of such returns over the long run.
As I have mentioned earlier, foreign investors are increasingly investing into India through low cost ETFs, which are mostly linked to the major indices. At the same time, aided by the Indian regulators and macro worries, domestic flow has shifted to the same set of index stocks. Large cap fund managers have a limited universe to choose from. How can a fund manager significantly outperform the index if everyone is forced to operate in the same universe of 100 largest stocks to build their portfolios consisting of 20-50 stocks?
This reminds me of the following paragraphs from Howard Marks’ June 2018 memo –
“The large positions occupied by the top recent performers – with their swollen market caps – mean that as ETFs attract capital, they have to buy large amounts of these stocks, further fueling their rise. Thus, in the current up-cycle, over-weighted, liquid, large-cap stocks have benefitted from forced buying on the part of passive vehicles, which don’t have the option to refrain from buying a stock just because its overpriced.
Like the tech stocks in 2000, this seeming perpetual-motion machine is unlikely to work forever. If funds ever flow out of equities and thus ETFs, what has been disproportionately bought will have to be disproportionately sold. It’s not clear where index funds and ETFs will find buyers for their over-weighted, highly appreciated holdings if they have to sell in a crunch. In this way, appreciation that was driven by passive buying is likely to eventually turn out to be rotational, not perpetual.”
In the long run, earnings growth is what will drive the returns. I don’t know of anyone who has consistently been able to time and jump between various styles of investing to create superior returns. In fact, I know of many who have done that to destroy returns.
Strategy of investing in high quality expensive consumer oriented stocks
With the volatility of emerging markets such as India, one segment that has delivered stable and relatively non-cyclical growth has been the consumer oriented large cap stocks such as HUL, Asian Paints, Maruti Suzuki, etc. Here the argument is that valuations don’t matter, given that these are the most consistent businesses that will continue to grow at above average levels for a prolonged period and with relatively low volatility. Questions is, with such a simple strategy if you can deliver alpha, why complicate your investment strategy.
To analyze the history, I created a portfolio of 25 companies with the highest ROE and consistent growth. Following are the key historical and current parameters:
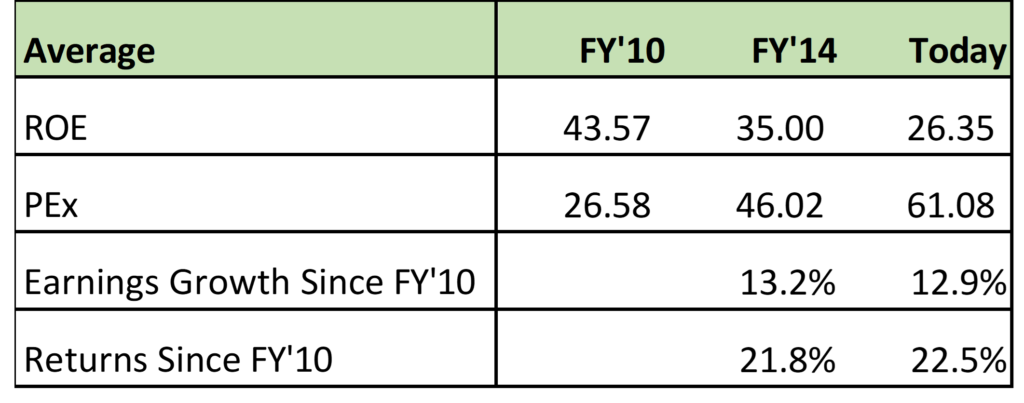
The earnings growth has surely been superior to the BSE 500 or Nifty 50 which has averaged around 4-7% during the same time frame, but as you can see almost half of the stock returns have been because of the PEx rerating. Question is, can this sustain when the current
multiple is above 61x. I believe that from these levels, it is improbable that valuations rerating will contribute to the returns, which going forward should be at or below the earnings growth. If these set of companies continue their 4-5% superior growth above the market, it’s probably a safer way to generate 10-17% reliable returns in the long run. No wonder this has remained a crowded trade for a long time.
Our Strategy
Unless forced by regulations, there is no reason for an investor to be restricted by market cap. Of course, liquidity has to be a consideration. Our mandate is to optimize returns, and that can be done by finding the companies with best long-term earnings growth prospects and buying them at reasonable prices. Given that our endeavor is to achieve earnings growth of 25% at the portfolio level, many of the large companies never fit the criteria due to their large base. It’s improbable that companies such as TCS, HUL or an Infosys which tend to grow earnings in single digits will ever be part of the portfolio, even if in the short run there is a possibility of enhanced returns due to valuations getting rerated. We don’t like to rely on valuation rerating for returns.
We completely believe in investing in high quality stocks, but it has to be accompanied by high earnings growth, which generally is possible where the base is relatively small and the companies can keep gaining market share from the competition. My observation has been that these kind of companies sustainably outperform not only the indices and the large cap quality companies but also deliver higher absolute returns albeit with higher volatility compared to large quality companies. If I had built a passive portfolio of such companies, the earnings growth over the past 8 years as well as 4 years would have been around 18-19%. Again because of the rerating, the returns would have been double of that.

The above table is for a passive portfolio of about 25 stocks which also includes some of the companies we have held in our portfolio in the past such as Bajaj Finance, Page Industries, Amara Raja Batteries, PI Industries, etc. The key difference between this and the large cap portfolio is the average size, which in this case was around INR 6,000-10,000 crs, if you had invested in these 3-4 years ago. We find this to be an optimal average size which provides enough liquidity and good earnings growth potential. Accordingly, our portfolio average company size falls in this range as it’s positioned from a 3-5 year perspective.
In the long run, the earnings growth of these companies would continue to be 6-7% higher than similar large company universe and we all know what compounding can do to your wealth with such superior returns.
Portfolio Positioning
We have seen earnings growth picking up for our portfolio. Almost half of our concentrated (SCP) portfolio allocation is towards export-oriented companies who would be net beneficiaries of the INR depreciation. These are companies in which we have invested before the INR depreciation started and they have been growing above our targeted rate since then and are not dependent on INR benefits. Most of these companies are constrained by capacity and not by demand. Unfortunately, during the current fearful environment, investors care less about the fundamentals and have been selling indiscriminately.
Since the beginning of the year, the YOY quarterly earnings growth of our portfolio companies have averaged significantly above 30%, but during this time the prices have corrected. Given the fundamentals, I find the valuations more attractive than any time in the past 4 years. Following is how our portfolio compares with the breakup of Top 1000 companies I presented at the start:
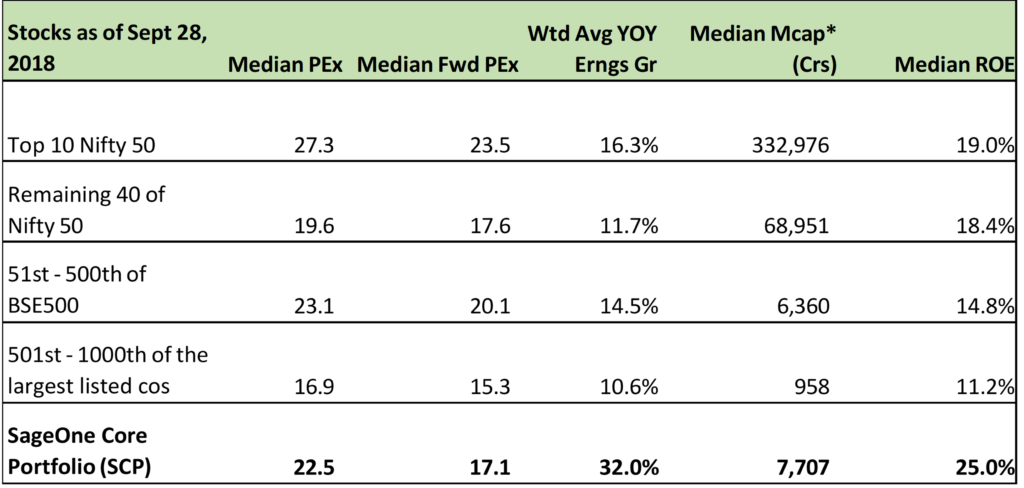
*SCP Mcap is weighted by allocation
Elections and macro worries
During my interaction with investors as well as professional fund managers, the most common question/discussion has been on what will happen if Prime Minister Modi loses in the upcoming national elections. History across countries has shown us how stock market returns and development of a country can take differing paths. I believe, it’s not necessary that a government which is the best for the country and its population is similarly best for the stock market (especially in the short term). Hence, I find it pointless in spending too time on analyzing such outcomes. Time is better spent to make sure that your portfolio companies are not dependent on such outcomes.
I have enlisted many macro fears earlier. Because of these, almost all investors (even the most sophisticated and experienced) are scared to a level not seen since the Lehman crisis. On the other hand, when I speak to management of companies about their businesses, they seem to be getting more confident. Of course I am talking about the companies we are invested in or track closely and may not be applicable to weak companies whose businesses are vulnerable to volatile macros such as rising yields or currency depreciation.
I had presented an analysis of the 2008 crash in my Nov ’17 memo. Of the top 1000 companies at the Jan ’08 peak, if you had invested equally in the 250 best quartile (ranked by best cash flow generation) companies and remained invested through the crash, you would have recovered all the losses by Aug ’09 i.e. within 5 months of the bottom in Mar ’09 and within
1.5 years from the top. This is the exact reason why investors should have a long term time horizon, when investing in equities, so that earnings growth and returns get enough time to converge.
I don’t think the current crisis is even a shadow of the 2008 financial crisis and investors should focus on fundamentals rather than worry about the volatile macros. This kind of fearful environment can reverse and turn exuberant in no time. Improving fundamentals and scared investors is the preferred environment for investments not the other way around. Rather than differentiating between companies by size, it’s important to differentiate them by strength/quality of their businesses, which can ride through various macro scenarios and governments.
Update on Fund Raise
As you know, we opened our PMS for new subscriptions for a very short period earlier this year. After completing the intended fund raise, we have closed it from mid of this month. We are happy to see much higher funds inflow this year when the market sentiments are fearful compared to last year when markets were exuberant. In the next few months we intend to launch a category III AIF and will keep you informed on further developments. Even though we don’t try and time the markets, we are much more comfortable raising funds in today’s environment compared to what existed 9 months ago.
I would like to thank you from the bottom of my heart for your continued support and your faith in SageOne even during this volatile period.
Warm Regards,
Samit S. Vartak, CFA
Chief Investment Officer (CIO) and Founder
SageOne Investment Advisors LLP
Email: ir@SageOneInvestments.com
Website: www.SageOneInvestments.com

*SageOne Investment Advisors LLP is registered as an Investment Advisor and PMS with SEBI.
Appendices
PMS Portfolio* Performance (Net of Fees)

* PMS portfolio is composed of 20 equal weighted stocks. Details of SCP are given below.
Investment Advisory Core Portfolio Performance (Gross Before Fees)
Below is the gross (pre-fees but excluding dividends) performance of our core portfolio in INR terms for the last 9 years and 6 months. For the first three years, we managed proprietary funds and for the last 6 years and 6 months, we have been advising external clients. Since clients have joined at various stages, individual performance may differ slightly based on the timing of purchases. For uniformity and ease, we measure our performance using a “representative” portfolio (that resembles advice given to clients) and we call it SageOne Core Portfolio (SCP). SageOne core portfolio is not a dummy portfolio but the CIO’s actual total equity portfolio.
9 Years 6 Month Gross Performance in INR (Apr 2009 – Sep 2018)
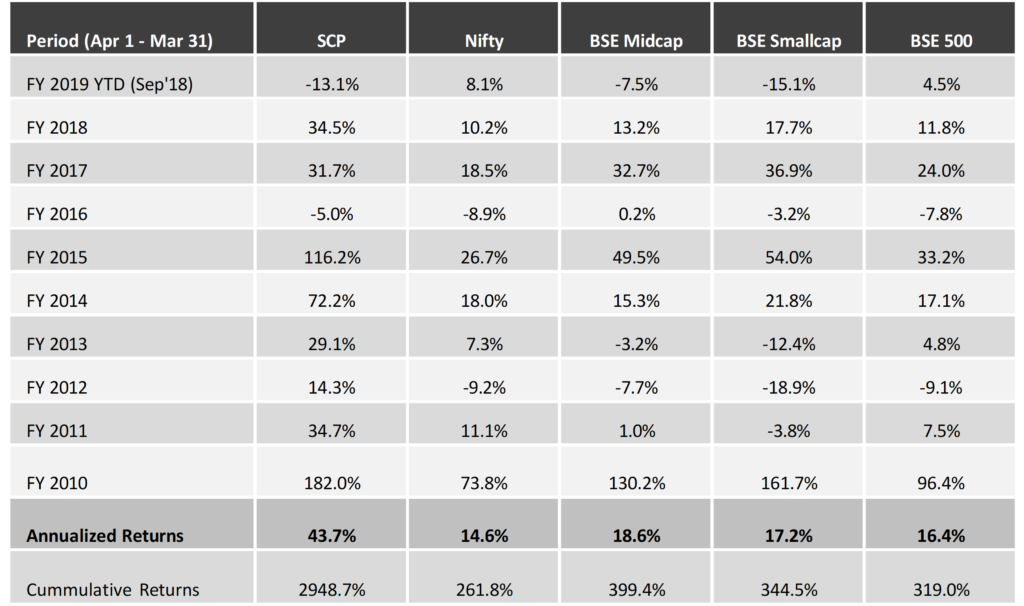
* SCP consists of 14 stocks as of Sep 30, 2018. Investment Advisory and large PMS clients are advised this portfolio.
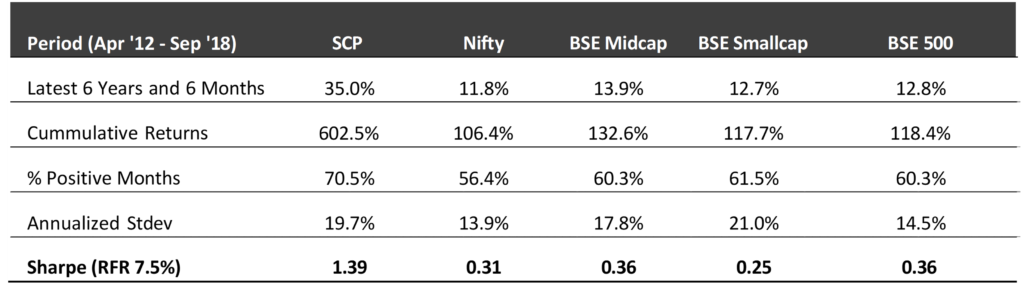
Core Portfolio: Latest 6 Years 6 Months Performance (Apr 2012 – Sep 2018)
First 3 Years Performance (Apr 2009 – Mar 2012)
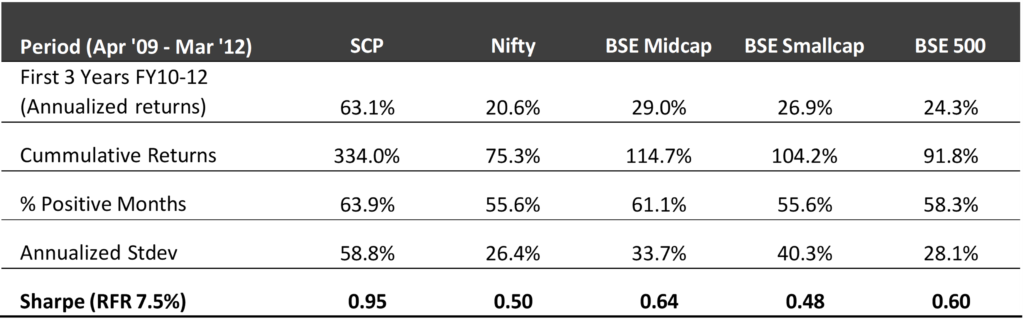
*We have consciously changed the composition of the core portfolio in terms of the average size of companies and the number of stocks in the portfolio after we started advising external clients in April 2012.
*The weighted average size of stocks at the start in FY10 was below $0.25 bn which has increased to nearly $1.3 bn by the end of Sep ’18. Also, the number of stocks has increased from 5 (+/- 2) in 2009 to 14 (+/- 2) during the past 6 years and 6 months.
*Reasonable diversification was done by design to improve liquidity and reduce volatility as a result of which annualized standard deviation has come down from 59% for the first 3 years to 19% during the last 6 years and 4 months.
Legal Information and Disclosures
This note expresses the views of the author as of the date indicated and such views are subject to changes without notice. SageOne has no duty or obligation to update the information contained herein. Further, SageOne makes no representation, and it should not be assumed, that past performance is an indication of future results.
This note is for educational purposes only and should not be used for any other purpose. The information contained herein does not constitute and should not be construed as an offering of advisory services or financial products. Certain information contained herein concerning economic/corporate trends and performance is based on or derived from independent third-party sources. SageOne believes that the sources from which such information has been obtained are reliable; however, it cannot guarantee the accuracy of such information or the assumptions on which such information is based.