
Dear Investors,
After a very favorable and smooth calendar year 2017, the New Year has been volatile wherein Indian indices have had drawdowns ranging from 10% to 20% from the peak in January. If you consider the small and mid-cap universe consisting of more than 900 companies, the median fall in prices from the 52 week high has been 30%. As I had presented in my last memo, the small and mid-cap universe had seen phenomenal rise in 2017 and completely divergent from the earnings growth. Such divergence is never sustainable. Now everyone is talking about worsening macros for India in terms of rising oil prices, high bond yields and rising political risk. At the same time, operating performance of companies across sectors is improving significantly. Weakening macros generally mean bargain prices and improving micros mean better product. Better products at discounted prices are always welcome.
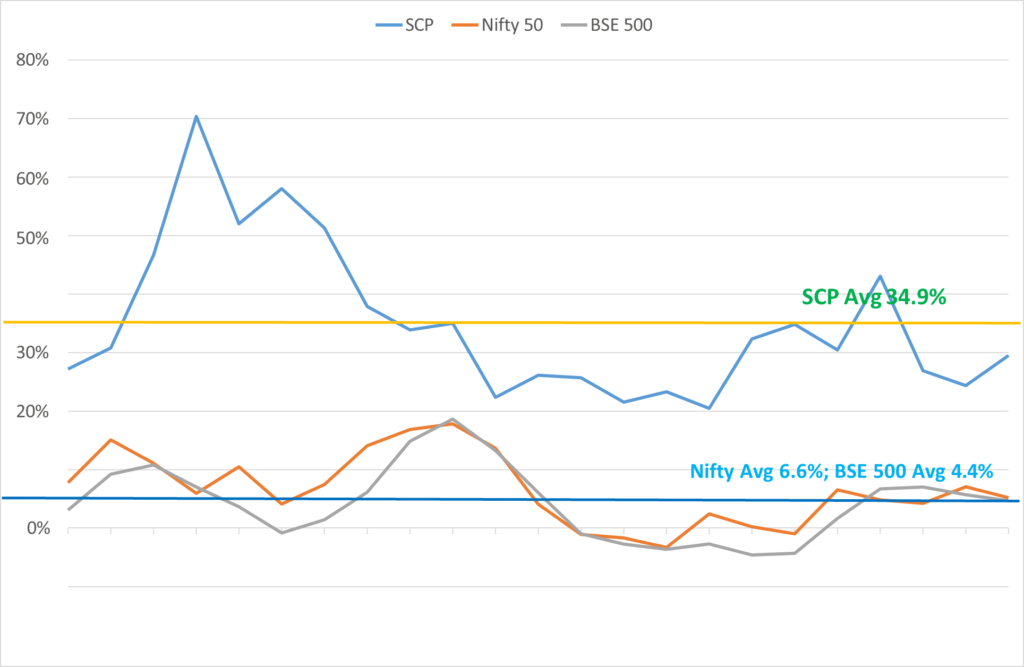
For SageOne, FY 2018 (Apr’17 – Mar’18) was a reasonably good year in terms of earnings growth for the portfolio companies. The weighted average earnings for our portfolio (SCP) increased by 29% YOY during the latest released 4 quarters compared to 5% for the BSE 500 and Nifty 50. We are satisfied that our portfolio returns* of 34.5% for FY18 and outperformance (ranging from 24% vs Nifty to 17% vs BSE Small Cap) were driven by earnings and not by valuation re-rating. Our investment strategy revolves around finding businesses with superior earnings growth combined with valuation expertise. Our goal is to replicate our historical portfolio earnings outperformance (graph below) as well as absolute earnings growth in the future.
Historical Trailing Twelve Month (ttm) Earnings growth
*Note: Our detailed portfolio (SCP) performance is presented in the Appendices at the end of this memo
There are many investors these days following philosophy of investing in quality companies. It’s common to hear from legendary successful value investors on how they have outperformed by focusing on quality businesses with “moats”, great managements, and businesses with huge market potential, etc. Many of these terms are over used and it’s difficult for most to differentiate one from another because everyone seems to be talking the same language.
“You won’t get the returns Buffett and I got by doing what we did” – Charlie Munger
It’s useful to remember that the USA has been one of the most successful industrial nations during the investment horizon of legends such as Warren Buffet. “Moat” businesses were available in plenty and at bargain prices in that country which has produced the best of global brands (across many industries), global technology companies, global pharmaceutical companies and global financial institutions. When a domestic company becomes global, the quantum and duration of growth are both high. Running large global businesses isn’t common in India and hence similar quantum and duration of growth will be difficult.
I believe that even though the fundamentals of investment analysis do not change, one has to customize the investment strategy to find non-crowded spaces and opportunities that may emerge specific to the country. In this memo I plan to focus on detailing our investment strategy that has enabled us to identify businesses with superior earnings growth at reasonable prices. Since I have covered valuation multiple times in my memos, I won’t talk much about that aspect in this memo. For those who are interested, you may want to listen to my latest webcast at Indian Investment Conclave .
What do we look for in companies?
The most important factor in an investment which defines quality for us is that the company should be strategically well positioned to gain market share from the competition without diluting profitability (and at ROCE > 20%). It is crucial for us to understand the factors that have helped the company to develop sustainable competitive advantage that would enable market share gain going forward. Also important is to have multiple drivers behind the advantage and not be dependent on just one or two. It’s helpful to differentiate between companies who have done well just because of luck from those who have done it using a well-designed strategy.
We target minimum 20% sustainable earnings growth at the company level and this is extremely difficult to consistently achieve relying just on the industry growth. Most industries in India grow around the nominal GDP growth rate which is around 12-13%, but 20% plus growth is possible only when companies either gain market share from competition (in existing or new geographies) or enter new market segments or create new market segments. When a company increases its market share from 2% to 2.5%, it adds 25% incremental topline growth over the industry growth. If the company can further achieve operating leverage, incremental earnings growth can be substantial.
At the start of my investment journey 20 years ago, I made several mistakes by giving too much credence to the management and analyst guided growth, rather than developing my own conviction based on analyzing factors that would enable that growth. Suffering through the pain of my hard earned savings getting wiped out through bad investments forced me to do the hard work studying factors that drove competitive advantage.
Later working as a management consultant advising companies on growth strategies and cost optimization, reinforced my belief that competitive advantage doesn’t get built by chance but has to be designed. A lot of hard work, planning and strategizing goes into developing a sustainable advantage which can vary widely across industries, regions/countries, periods and companies. Let me present a few examples of companies which successfully designed a strategy to gain market share over a sustained period.
Disclaimer: The ideas presented in this memo may or may not be part of our or our client portfolios. They are presented just for educational purpose. Please read our detailed Disclosures at the end of this memo.
| Competitive advantage evaluation is not absolute, but relative and to do that one needs to study strategies/positioning of competition. Bajaj Finance (BFL) is one of the best examples in India where they have successfully done it in consumer lending over the past decade. Following our study of the competitive environment in FY10, following are few of the key points I had noted in my internal buy note: Reduced Competition and Improving Pricing Intense competition had led to yields in consumer financing drop by 300-400bp over FY03-07, spike in non-performing assets (NPAs) and consequent exit of multiple players. This significantly reduced competition and thereafter, product yields jumped (by FY10) from 17-20% to 22-24% without change in risk profile. New Management Until FY08, BFL was focused on unsecured lending in terms of personal loans and 2/3 wheeler financing. By the end of that year, a young and competent new CEO was brought in. He was given the freedom to develop his strategy and build an organization to implement that. Reduced Risk The company strategically decided to get away from the mass-market approach (lesson learnt from 2008 asset losses) and focus on affluent customers as its target segment. Emphasis on affluent customers with a healthy credit history ensured better asset quality. Invested significantly in building credit evaluation infrastructure and became one of the first and biggest user of CIBIL/credit scores in India. Fast client verification (KYC) and instant credit scoring (5 mins vs a day for others) is even to date unmatched after 9 years. Cross Selling and Reach Strong emphasis on cross-selling. A customer once acquired through BFL’s consumer durables segment, on satisfactory performance, was offered the entire gamut of services including personal loans, insurance products and small business loans. From just a couple of product verticals, they created 8 more large verticals. A young and talented team was built, right incentive structure was put in place and they were provided with all needed enablers to succeed. Incentive structure wasn’t just linked to asset growth, but focus was on profitability. The team created distribution reach across India that was unthinkable then. The first mover advantage in products and regions created added benefit of size and operating leverage. This in itself is a huge advantage. RESULT: 40% plus annualized growth in credit, net interest income and net profits over the last 8 years when comparable number for the industry ranged between single digits to low-teens. Strategy to build a durable competitive advantage is like preparing a wonderful dish. It needs all the right ingredients and in the right proportion. The combined advantage for BFL was very large, difficult to overcome and hence has been sustainable even today. |
There are many such examples which have grown at a rate which is multiple times of that for the industry only because they strategically positioned themselves to take away market share from the competitors.
| Page Industries did it by creating superiority across various aspects of the business. In addition to being the master franchise for the brand “Jockey”, they created unmatched cost efficiencies, consistency in quality and distribution network. For cost efficiency, they focused on high volume products only. When I had met them, as well as Lovable Lingerie around the start of this decade, Page had 500 SKUs (stock keeping units) while Lovable had 5x of that even after being a smaller player as well as just offering Women’s innerwear. Imagine the difference in the carrying cost and unsold inventory of stocking those many SKUs in thousands of retail stores across the country. Page is a master at workforce management. They focused on young women workforce from villages, who were less prone to unionization (a common problem faced by companies in labor intensive industries and its competitors in India) and came at a lower cost. Providing best infrastructure, process and training ensured quality. Such cost and quality remains unmatched even today by other international brands who have struggled. Add to this the distribution reach, new product category launches and economies of scale and the combined competitive advantage is difficult to overcome. I was stunned when one of its key competitor told me that, “Page ranks number 1 through 9; rest of us start at number 10”. No surprise that Page has been sustainably taking away market share. Over the last decade its earnings have compounded at 32% CAGR which is multiple times of the industry. |
Sustainable and profitable growth also possible in cyclical industries
Many companies never get high valuations, even after consistently delivering high earnings growth and sustaining profitability across market cycles just because they get categorized as part of a cyclical industry. We have found great bargains in some of these companies which have stronger competitive advantages compared to many average companies in favored stable industries.
In steel industry, some manufacturers are converters. They buy steel from the integrated players and the value addition is very low. One of the companies I have studied is in structural pipes manufacturing for multiple industries. Their raw material cost is ~ 85% of sales and net margins are barely 3-5%, but they have shown the ability to pass on increase in raw material prices to the consumer and thereby protecting their profit/ton. Even in the steel down cycle when many integrated players were going bankrupt, they continued taking market share which translated into profit growth.
When margins are so thin, even small incremental advantages create a huge differentiating factor.
→ This company because of its economies of scale and timely payments could negotiate raw material prices 0.25-0.5% lower.
→ Their strong balance sheet enabled them to get working capital loans at rates 100-200 bps better than the competitors.
→ Their plant locations and distribution network enabled quicker delivery to the retailers across India.
→ Because of their strong balance sheet, they invested in doubling capacity with newer and more efficient machinery. This not only lowered their cost of production but also reduced their changeover time between batches from 24-48 hours to 2-4 hours. They could cater to smaller and more profitable orders.
→ Management was always on top of launching new value added products for newer industries thereby expanding the market in addition to gaining market share.
The combined savings could be just 2-3% of sales, but in this context the profitability differential is huge. With this ability, they can lower prices and drive the competition out. When they lower net margins from 5% to 3%, competition is breaking even. Such competition can’t afford to play or won’t want to play. Individually many of the above advantages could be replicated, but when you consider the balance sheet of the competitors, economies of scale and their management quality it is very difficult to replicate the combined advantage. This company during the last 5 years of tough steel cycle tripled its top-line as well as bottom- line.
Differentiating nature of growth
| Companies catering to the same industry can have very differing growth trajectories. Consider an explosives manufacturing company Solar Industries. They provide explosives to mining and infrastructure, both of which are very cyclical, but the demand for explosives isn’t as cyclical because it’s a consumable and is needed every year for blasting mines, digging tunnels, roads etc. The barriers to entry are very high in terms of licenses, land requirements, manufacturing process and economies of scale. Their cost effectiveness has enabled them to capture market share across the globe. Result of this is sustainable high growth and profitability. Compared to this, consider a furnace manufacturer or other capital equipment manufacturers catering to the same industries. Furnaces have extremely long life (sometimes 40+ years) and the demand just drops off when there are no new factories coming up. They follow a very different trajectory compared to the explosives business. Such differentiation has to be made in evaluating growth risks in businesses that are capex oriented versus those that are consumable oriented such as refractories, abrasives, etc. Many a times we have found mispricing in such businesses just because of industry risks. |
I have widely written and presented (link) on how Balkrishna Industries kept growing its earnings at 20% per year during a period when the global market for its products shrunk by 30%. A company with sustainable competitive advantage can grow even in the toughest of environments because many weak players can’t survive during such phases and give away market share. Amara Raja, using a better strategy and product positioning, improved margins and market share, while Exide went the other way during 2011-2015. Hawkins even after having the best products in cookware lost market share over the last decade because competition had better product strategy and execution.
I can continue giving examples after examples of companies who have delinked their growth trajectory from the industry growth only because of market share gain. I believe this is one of the best ways to prepare your portfolio for not only the boom times of the economy but more importantly for the rough weather. Such companies outperform relatively as well as do well on an absolute basis.
There is phenomenal “Moat” around some businesses such as brands, IP, distribution, etc. but if they can’t gain market share it means that the competition probably has similar moat or the company already controls most of the market share which cannot be improved upon. Both of these factors limit growth and for us become undesirable as investments. Having strong moat is a necessary but not sufficient condition for us in an investment. Differential in competitive advantage is more important. How management leverages the moat and positions the company against the competition is critical in creating value for shareholders. We have seen many examples, e.g. Hawkins or Kingfisher, in the most favored sectors having failed to create value.
Along with knowing the enablers of value creation, it’s important to know what can destroy or stagnate that. I will briefly touch upon a couple of such factors to stimulate thoughts in that direction.
Market share gain can also be a negative
Market share gain and growth may not necessarily be always good for a company. In many cases companies can destroy market value by going after inferior growth. It’s easy to increase volume by increasing capacity and lowering prices, but as an investor it’s important to carefully evaluate the return on incremental capital. Company averages may hide the poor quality growth for years and you might spend long periods without any return as an investor in the company because the growth only added topline and bottom-line, but no economic value. I have covered this concept in my presentation on Valuation (link).
Promoters (Founders) can themselves be enemies of growth
Everyone has their own way of evaluating managements. For me, one of the key insights I try to get when meeting managements and visiting plants is how the employees are incentivized and empowered. Many promoters control each and every aspect of the business and employees just act as pawns without any authority to take key decisions. There is very little delegation of responsibilities from the promoters and such authority only creates a bottleneck for growth. Such businesses face scalability issues because they find it difficult to gain market share beyond being a regional player. Bajaj Finance is a prime example of how much value can be created by hiring, empowering and incentivizing the right talent.
At SageOne, analyzing the quantitative parameters of any business provides insights into the history of the company and it’s a good starting point, but evaluating the qualitative enablers and hurdles provides insights into the future of the company. Both are important to evaluate risks and potential of an investment.
Warm Regards,
Samit S. Vartak, CFA
Chief Investment Officer (CIO) and Partner
SageOne Investment Advisors LLP
Email: ir@SageOneInvestments.com
Website: www.SageOneInvestments.com

*SageOne Investment Advisors LLP is registered as an Investment Advisor and PMS with SEBI.
Appendices
PMS Portfolio* Performance (Net of Fees)
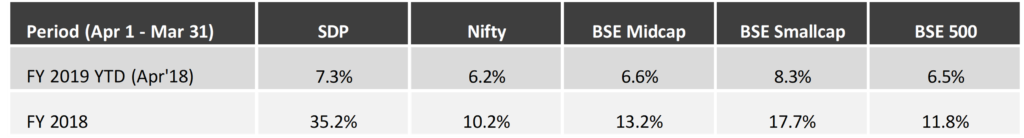
* PMS portfolio is composed of 22 equal weighted stocks. Details of SCP are given below.
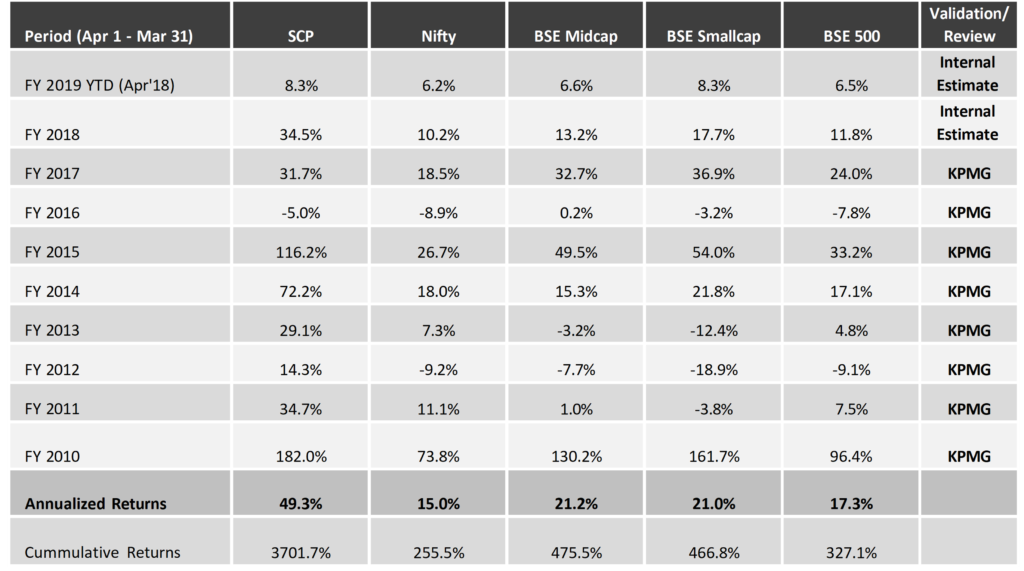
Investment Advisory Core Portfolio Performance (Gross Before Fees)
Below is the gross (pre-fees but excluding dividends) performance of our core portfolio in INR terms for the last 9 years and a month. For the first three years, we managed proprietary funds and for the last 6 years and a month we have been advising external clients. Since clients have joined at various stages, individual performance may differ slightly based on the timing of purchases. For uniformity and ease we measure our performance using a “representative” portfolio (that resembles advice given to clients) and we call it SageOne Core Portfolio (SCP). SageOne core portfolio is not a dummy portfolio but the CIO’s actual total equity portfolio.
9 Years 1 Month Gross Performance in INR (Apr 2009 – Apr 2018)
* SCP consists of 15 stocks as of April 30, 2018. Investment Advisory clients are advised this portfolio.
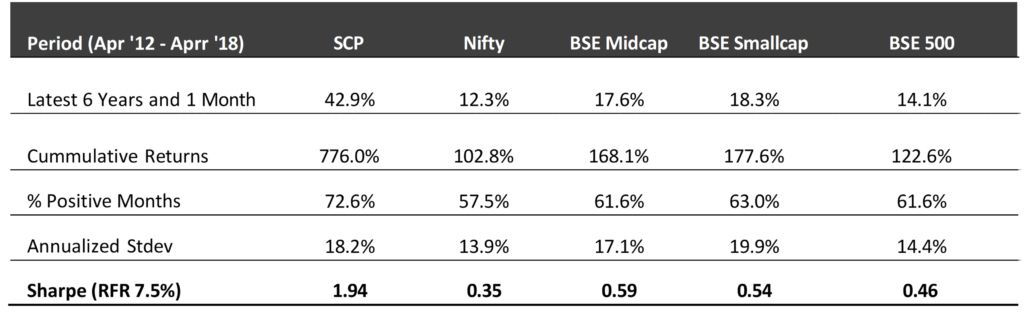
Core Portfolio: Latest 6 Years 1 Month Performance (Apr 2012 – Apr 2018)
First 3 Years Performance (Apr 2009 – Mar 2012)
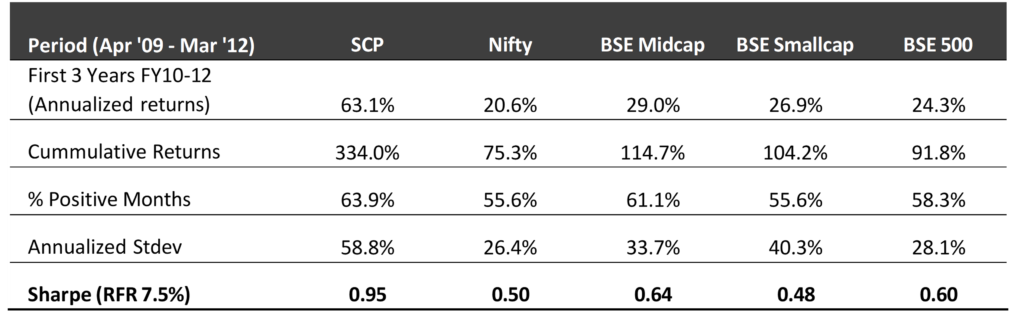
*We have consciously changed the composition of the core portfolio in terms of the average size of companies and the number of stocks in the portfolio after we started advising external clients in April 2012.
*The weighted average size of stocks at the start in FY10 was below $0.25 bn which has increased to nearly $1.5 bn by the end of Dec ’17. Also, the number of stocks has increased from 5 (+/- 2) in 2009 to 14 (+/- 2) during the past 5 years and 10 months.
*Reasonable diversification was done by design to improve liquidity and reduce volatility as a result of which annualized standard deviation has come down from 59% for the first 3 years to 18% during the last 5 years and 10 months.
Legal Information and Disclosures
This note expresses the views of the author as of the date indicated and such views are subject to changes without notice. SageOne has no duty or obligation to update the information contained herein. Further, SageOne makes no representation, and it should not be assumed, that past performance is an indication of future results.
This note is for educational purposes only and should not be used for any other purpose. The information contained herein does not constitute and should not be construed as an offering of advisory services or financial products. Certain information contained herein concerning economic/corporate trends and performance is based on or derived from independent third-party sources. SageOne believes that the sources from which such information has been obtained are reliable; however, it cannot guarantee the accuracy of such information or the assumptions on which such information is based.