
Dear Investors,
As the world markets continue their smoothest rise against wide spread skepticism and high valuations, it once again reinforces the pitfalls of timing the markets. Many have tried and most have failed at it. The few who have succeeded probably are statistical outliers in a normal bell curve. The corollary to this is that one has to be fully invested at all times. If that is the case, how do you protect yourself from the bubble bursts and crashes in the markets?
When you invest for the long term and stay invested through the ups and downs of the markets, it’s extremely important to choose the right kind of companies. This is where having a clear and consistent long term investment strategy is critical vs employing an investment style that changes with the flavor of the season.
“Choosing individual stocks without any idea of what you’re looking for is like running through a dynamite factory with a burning match. You may live, but you’re still an idiot.” ― Joel Greenblatt
During the 2003 to 2007 stock market bull cycle, greed had completely overtaken fear and had reached extremes by the end of 2007. When sentiments reach such levels, the stock performances break their relationship with the earning performances and that’s what happened even during this phenomenal cycle. Downside was that many investors got stuck in some of the stocks that even now after nearly 10 years haven’t recovered the stock prices reached at the market peak on January 8, 2008. And these kind of stocks are not small in number but almost half of the top 1000 stocks by market value at the peak. I am pretty certain that similar kind of behavior would rhyme during the next big bubble and hopefully investors who remember the learnings would stay away from repeating the same mistakes.
When you study group of companies who went through the biggest fall and compare them with the group which went through the least fall, certain common differences emerge. Hopefully these would be helpful in building clarity in one’s investment strategy.
Note: Our portfolio (SCP) performance is presented in the Appendices at the end of this memo
Breaking Down the Crash of 2008-09
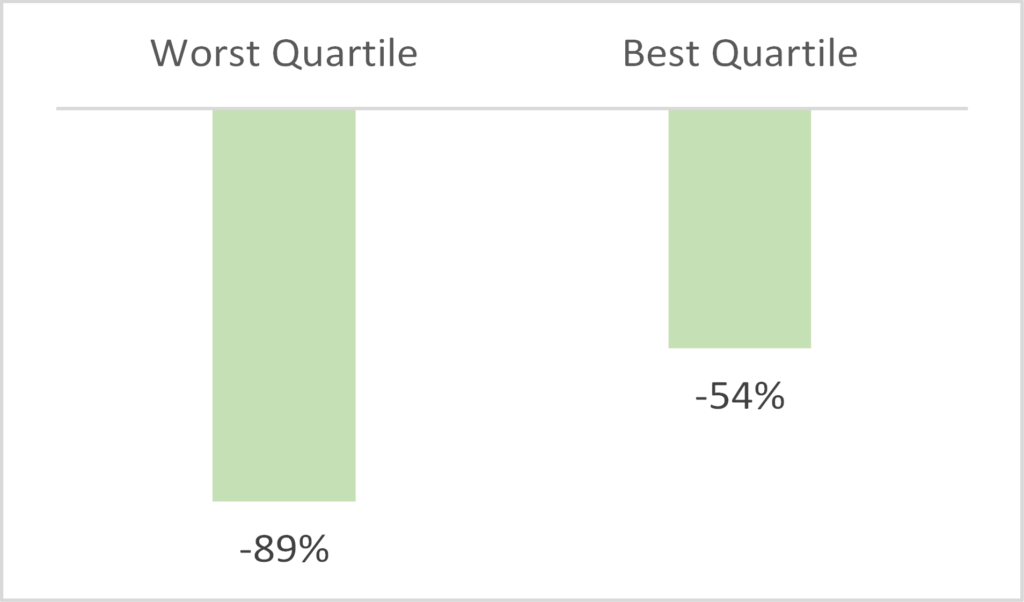
Fall in Stock Prices from Peak to Trough in 2008-09
The universe I have used for this analysis comprises the top 1000 stocks (by market capitalization) listed on the National Stock Exchange (NSE) and it represents more than 90% of the total listed market capitalization as of January 2008. I have divided the universe into four quartiles with around 250 companies in each and have sorted the companies based on the percentage fall from the top of the markets on January 8, 2008 to the bottom on March 9, 2009. The top quartile (Worst Quartile) represents companies with the largest fall and the bottom quartile (Best Quartile) represents companies with the least fall. While the median fall for the entire 1000 stock universe was 78%, the median fall for the best quartile was 54% and for the worst quartile was 89%.
Note: Finance companies excluded for most parameters other than PE, PB and ROE. Data Source: Ace Equity
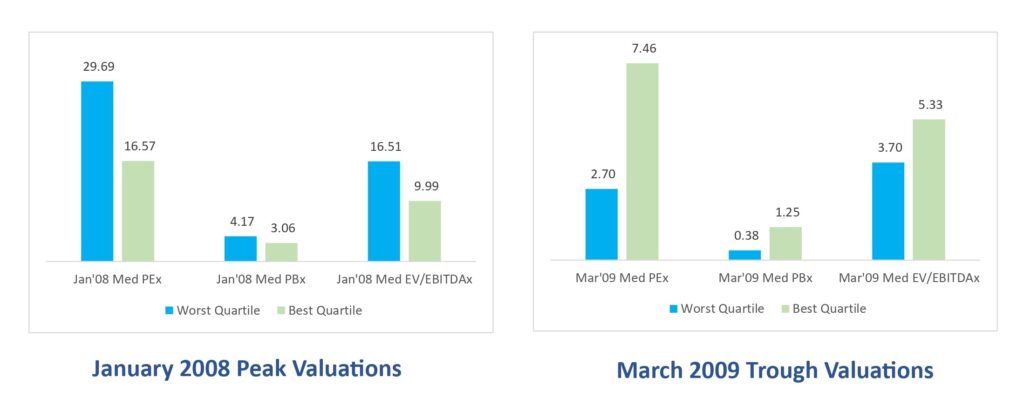
Difference in Valuation
I looked at the three main valuation parameters viz. PE, PB and EV/EBITDA and not surprisingly the valuation for the worst quartile was significantly higher compared to the best quartile, but more importantly they crashed the most during the fall.
Difference in Profitability and Balance Sheet Quality
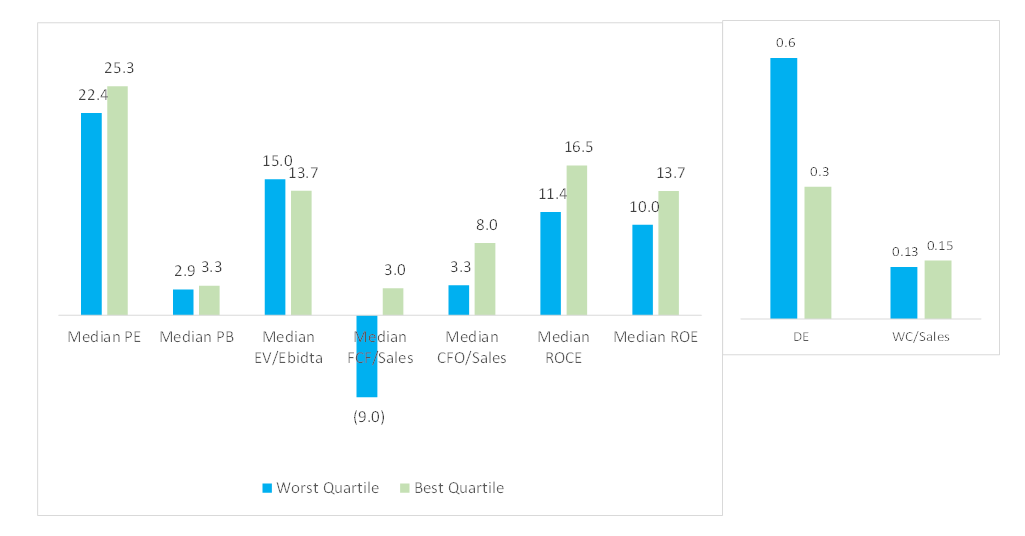
Generally companies with higher return ratios tend to trade at higher multiples on an average, but in 2007-08 bubble this relationship was broken. When you looked at the book profitability, the difference was already significant, but the alarming difference was in the cash flow ratios (CFO: Cash Flow from Operations and FCF: Free Cash Flow net of investments/capex). Companies with poor CFO went for big capital expenditure resulting in further denting the FCF. The worst quartile had very low cash flow from operations and free cash flow of –15.9% of sales compared to the book profits (net margins) of 7.6% of sales.
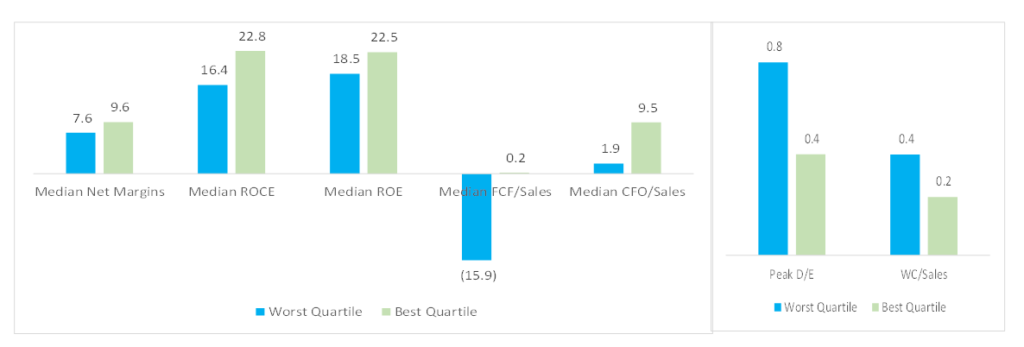
Parameters for FY 2008
When the worst quartile was relatively so inferior, why were investors paying higher valuation to these companies?
Momentum and Greed, a Lethal Combination
As can be seen even in today’s market environment in India, investors are quick to react to any slightest sign (rumor) of upcoming good quarter or any positive news on new orders. Many prefer to invest first and analyze later or else they can miss on a sudden stock jump of 20-30% and sometimes even higher in a matter of 2 or 3 days. Quickly getting on a fast moving train seems to be the key to superior performance rather than painstakingly spending months on studying the business. In such times the time spent (wasted?) analyzing companies seem to be a huge Opportunity Cost rather than knowledge gain that will be useful for years to come. Many who follow extremely disciplined investment process without compromising the quality can attest to this phenomenon/frustration that most of us may have experienced over the past 2-3 years.
Stocks were moving at multiple times faster in 2006-08 and greed was at much elevated levels compared to now. Time not wasted on analysis paid off big in the short run and that instilled bad lessons in many investors. With this context look at the:
Performance differential leading up to the Peak/Bubble Burst.
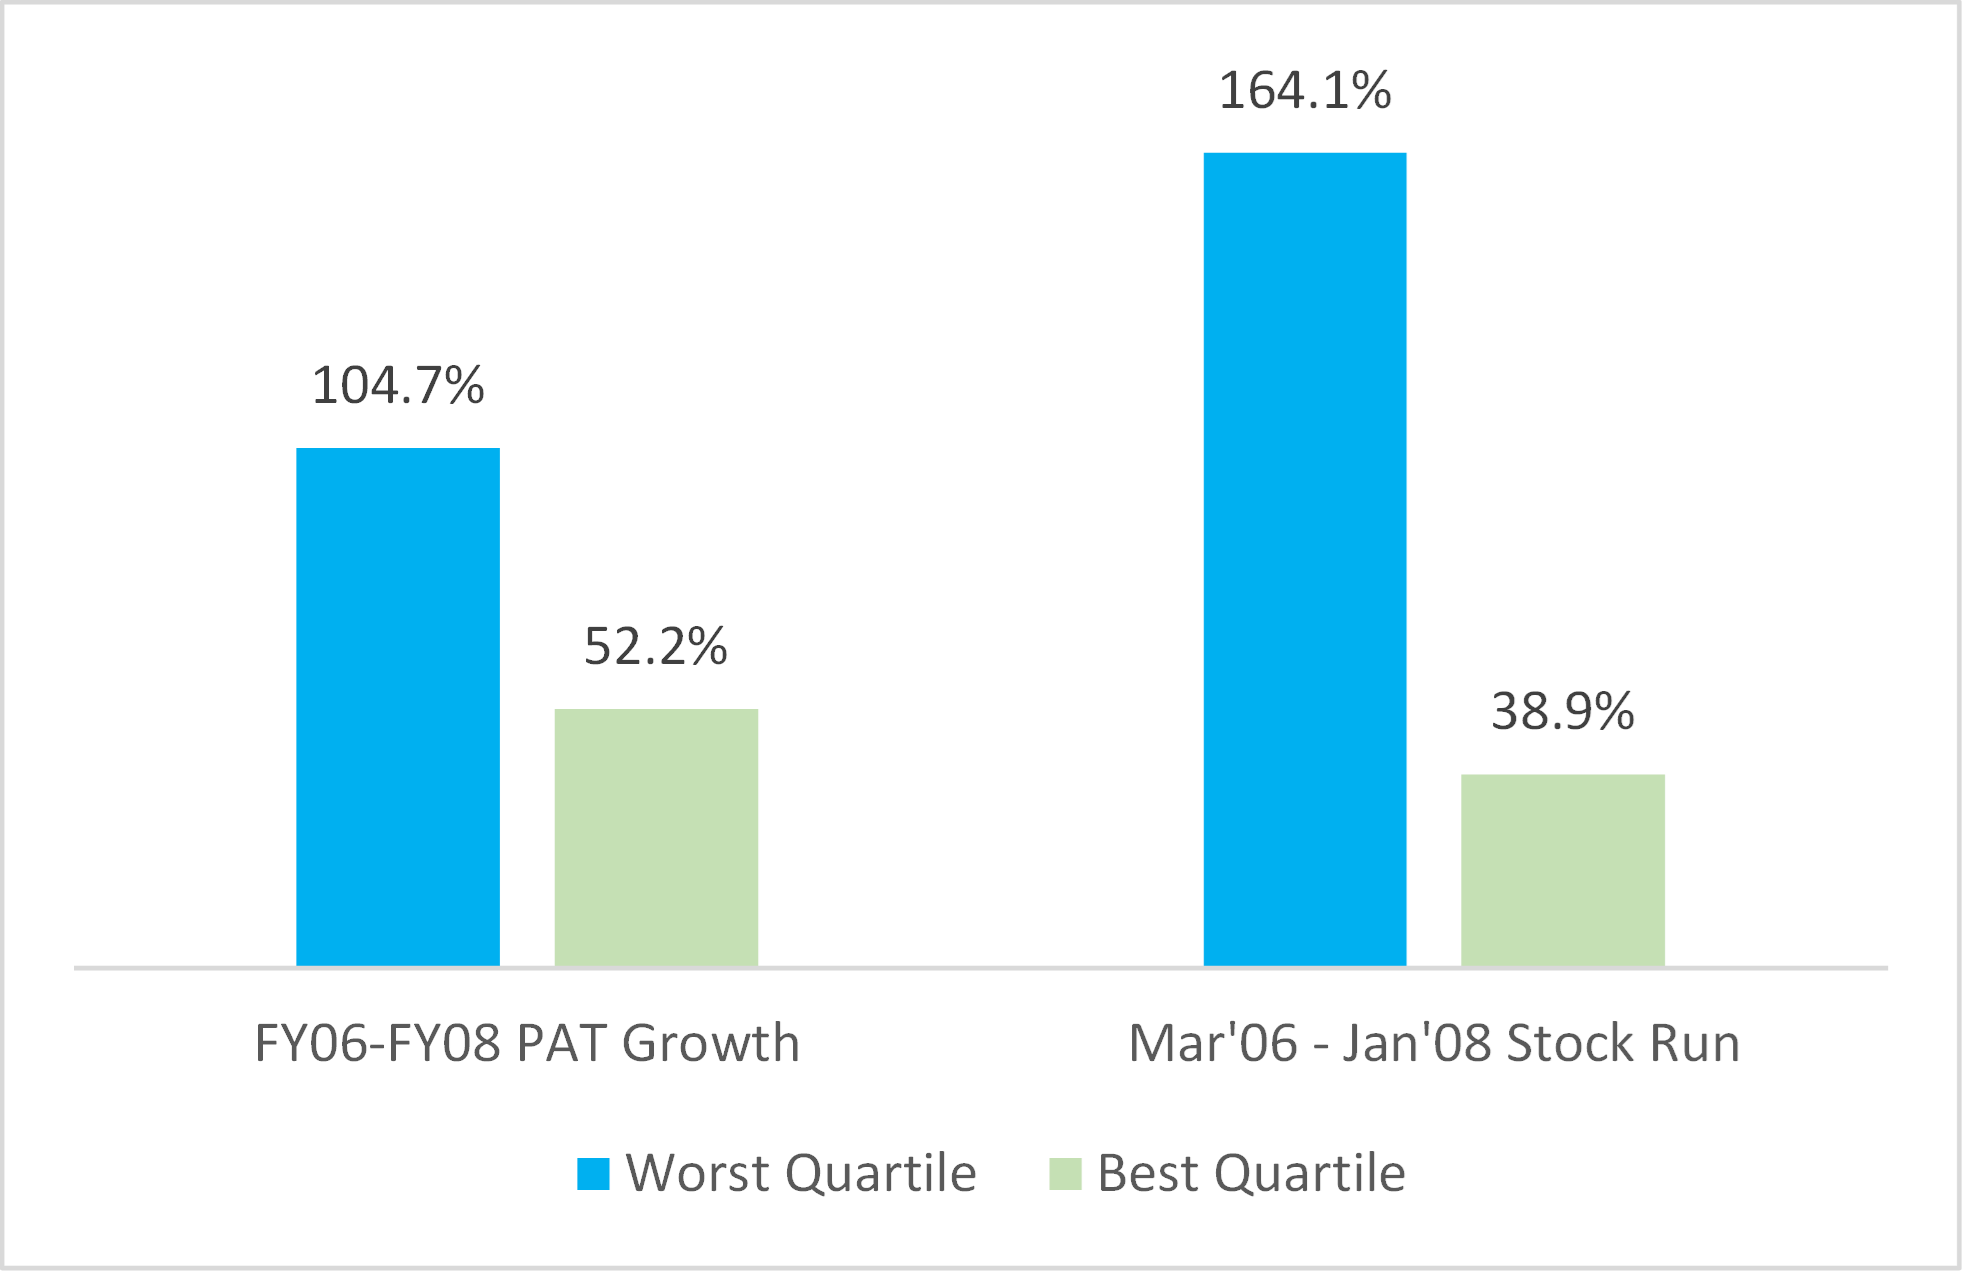
Stocks in the worst quartile moved up by 2.64x compared to just 1.38x for the stocks in the best quartile. Book profit (earnings) growth was also correspondingly high, and 2x rate of earnings growth resulted in 4x (164% vs 38%) rate of stock returns. Who can stay away from such momentum in returns as well as earnings? But was this momentum seen in cash profits?
Cash Profits were Out of Fashion
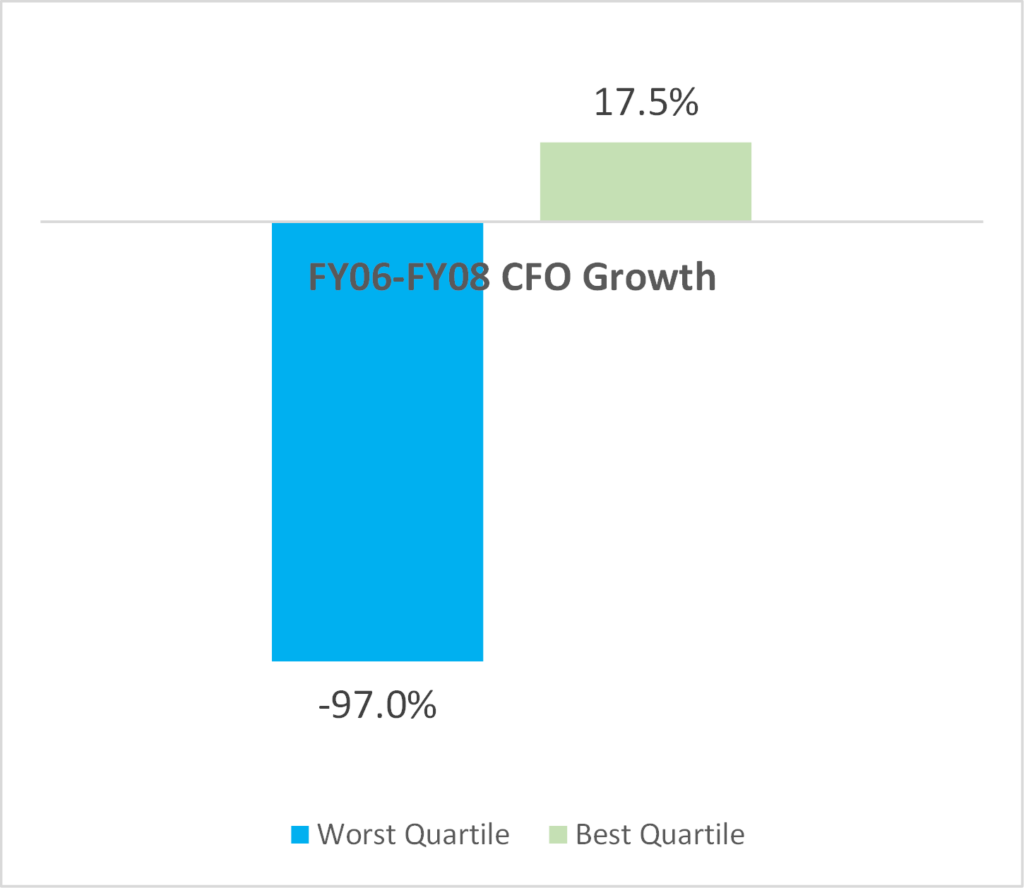
Median Growth in CFO
At the peak in January’08 the stocks in the worst quartile had a total market capitalization of INR 10 lac crs ($150 bn at current USD/INR rate) and those in the best quartile of INR 30 lac crs. Sum of cash flow from operations (CFO) for the worst quartile dropped from INR 4,180 crs ($0.64 bn) in FY06 to INR-1,470 crs (-$0.2 bn) in FY08, while that for the best quartile jumped from INR 0.9 lac crs ($14 bn) to INR 1.3 lac crs ($20 bn) during the same period. Even the median rise/fall was dramatically different as seen in the adjoining chart.
In the short run (can be few years) momentum trumps fundamentals, but in the long run real profits is what matters. This is clear when you look at performance of the stocks in the two quartiles from the peak or from the trough or even from couple of years prior to peak. Best quartile recovered its entire loss in market value within one year of the bottom (Mar’09), whereas the worst quartile hasn’t even in 2017. One might miss the short term excitement by sticking to the disciplined time consuming approach but would also miss the long term pain.
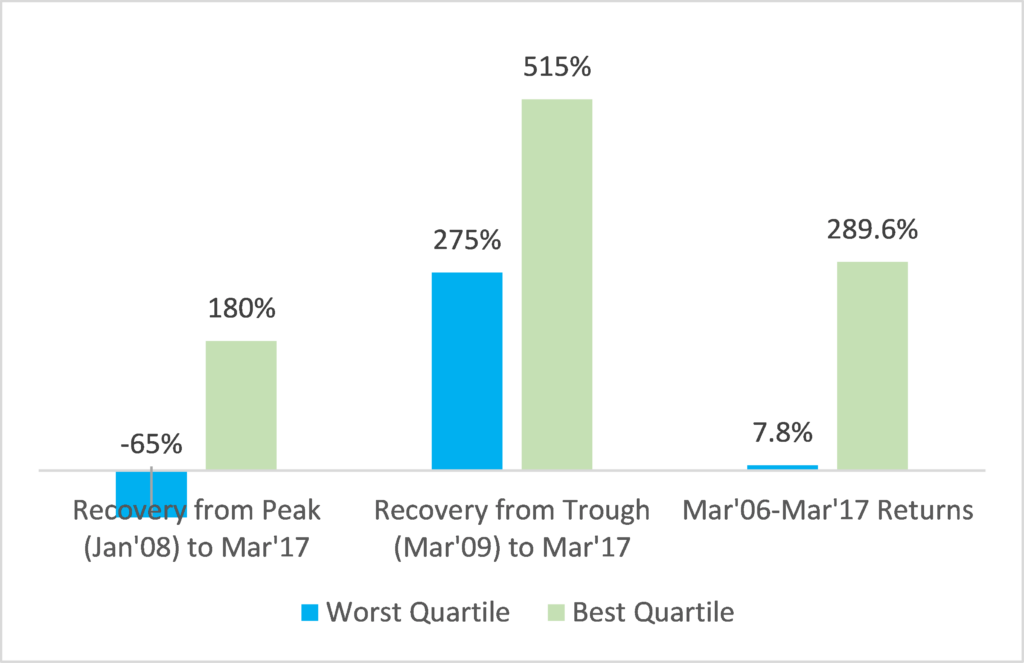
Median Recovery from Various Points up to Mar’17
Fundamental difference between today’s market and that at the peak in January’08
Today the balance sheet quality and cash profits are much better compared to 2008. Even though today’s PE valuation metric look comparable with that of the peak in 2008, I have presented the big differences using various other metrics (CAPE, PB, Mcap/GDP) in my last memo (August 2017) and hence am not revisiting those.
The above analysis was done “after the fact” knowing the companies which fell the most during the crash. Today we can’t break up the current list of companies using the same factor. Hence I have sorted them based on worst to best FCF (for FY17) as a % of sales. Currently the top 1300 companies listed on the NSE represent more than 90% of the total listed market capitalization in India. I have again divided these companies in 4 equal quartiles. Following is how the worst and best quartile compare in various parameters.
Parameters for Current Market as of Oct 25, 2017
One thing which immediately pops out from the chart is that even though there is considerable difference in the profitability (book as well as cash) ratios for the worst and the best quartiles, the valuations are at similar levels. I believe that the market rally over the past 4 years has been very broad based and indiscriminate. Result of this is that the difference in valuation for poor and good quality companies has significantly narrowed. Greed and fear of missing out has returned although to a much milder extent compared to what we saw in 2007-08.
During the previous bubble, sectors such as realty, infrastructure, mining, metals, aviation and consumer durables appeared prominently in the worst quartile. Today there is some similarity but no sector is prominent in the worst quartile.
How do we navigate through tricky markets?
In a cricketing analogy, we prefer to play technically right irrespective of whether the playing pitch is easy or difficult. This doesn’t mean we invest in defensive industries or stock. Our earnings growth hurdle (25%) is extremely high at portfolio level compared to earnings growth of the market, but that doesn’t mean we have to go down the quality curve. It’s just that we have to spend a lot more time in understanding the businesses and long term potential of the opportunities rather than focusing on short term momentum in book profits.
Currently SageOne Core Portfolio (SCP) has 14 stocks and the average valuation is below or close to the overall market, but we believe that the quality of our businesses is superior to even the companies in the best quartile at an average level. Following is a comparison of key metrics of the companies in the “Best Quartile of 2008”, “Best Quartile in the Current Market” and “SCP”.
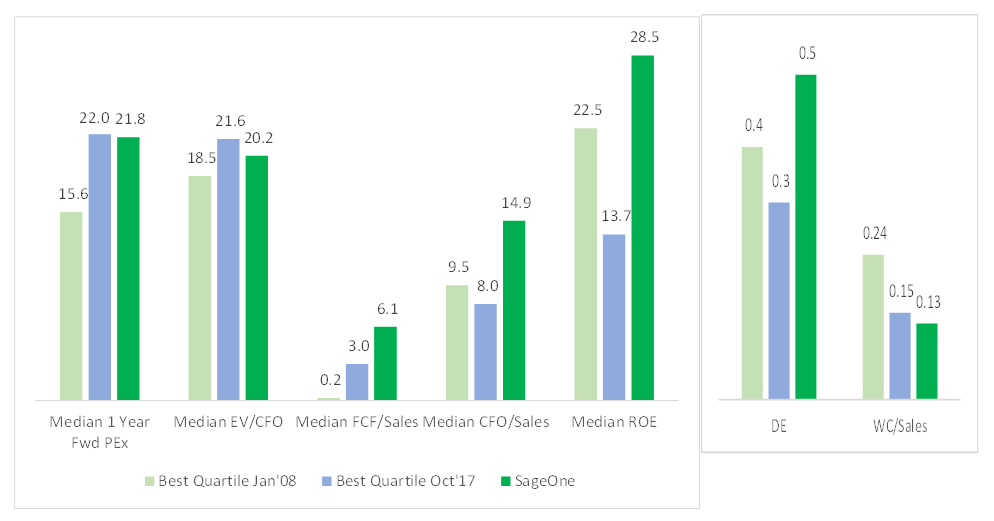
Comparison of key parameters (for the Best Quartile) with Our Portfolio (SCP)
“The single greatest edge an investor can have is a long-term orientation.” – Seth Klarman
When you are not good at timing the market, sticking to strong companies is crucial. That’s the best way to not only limit damage during crashes, but also recover the quickest. In a world where availability of information has become commodity, rare area where there is still inefficiency is in understanding the long-term potential of a business. That’s where we try to get an edge.
Warm Regards,
Samit S. Vartak, CFA
Chief Investment Officer (CIO) and Partner
SageOne Investment Advisors LLP
Email:sv@SageOneInvestments.com
Website:www.SageOneInvestments.com

*SageOne Investment Advisors LLP is registered as an Investment Advisor and PMS with SEBI.
Appendices
PMS Portfolio* Performance (Net of Fees)

* PMS portfolio is composed of 22 equal weighted stocks. Details of SCP are given below.
Investment Advisory Core Portfolio Performance (Gross Before Fees)
Below is the gross (pre-fees but excluding dividends) performance of our core portfolio in INR terms for the last 8 years and 7 months. For the first three years we managed proprietary funds and for the last 5 years and 7 months we have been advising external clients. Since clients have joined at various stages, individual performance may differ slightly based on the timing of purchases. For uniformity and ease we measure our performance using a “representative” portfolio (that resembles advice given to clients) and we call it SageOne Core Portfolio (SCP). SageOne core portfolio is not a dummy portfolio but the CIO’s actual total equity portfolio.
8 Years 7 Month Gross Performance in INR (April 2009 – Oct 2017)
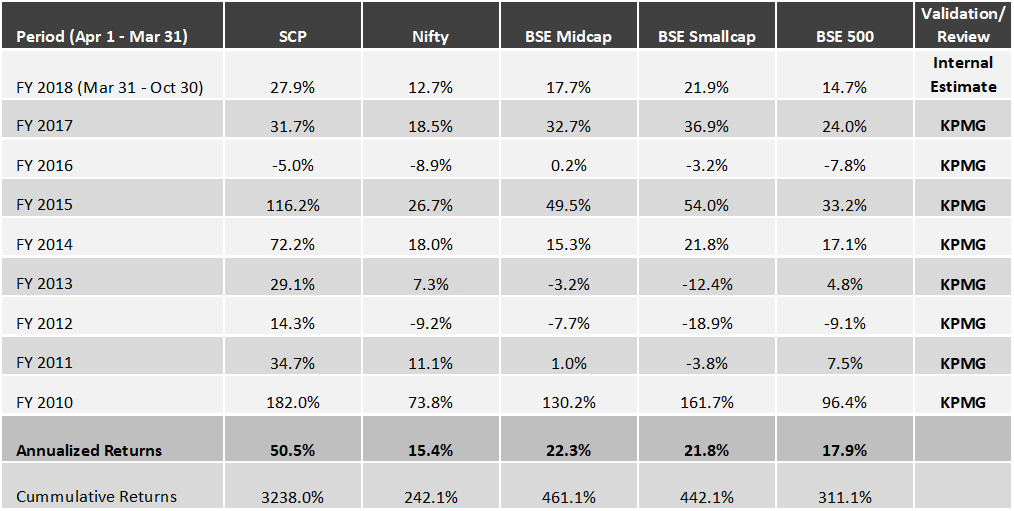
*SCP consists of 14 stocks as of Oct 31, 2017. Investment Advisory clients are advised this portfolio.
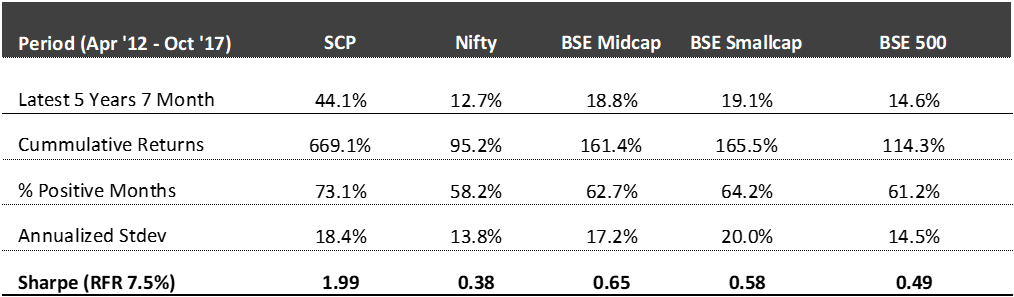
Core Portfolio: Latest 5 Years 7 Month Performance (April 2012 – Oct 2017)
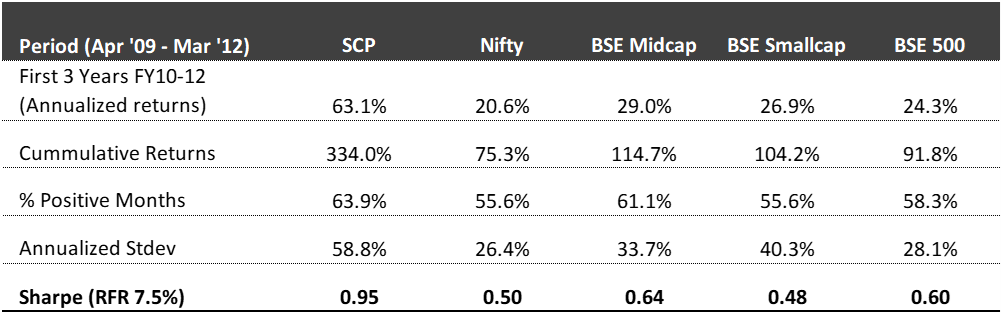
First 3 Years Performance (April 2009 – March 2012)
*We have consciously changed the composition of the core portfolio in terms of the average size of companies and the number of stocks in the portfolio after we started advising external clients in April 2012.
*The weighted average size of stocks at the start in FY10 was below $0.25 bn which has increased to near $1.2 bn by the end of Oct ’17. Also, the number of stocks has increased from 5 (+/- 2) in 2009 to 14 (+/- 2) during the past 5.5 years.
*Reasonable diversification was done by design to improve liquidity and reduce volatility as a result of which annualized standard deviation has come down from 59% for the first 3 years to 18% during the last 5.5 years.
Legal Information and Disclosures
This note expresses the views of the author as of the date indicated and such views are subject to changes without notice. SageOne has no duty or obligation to update the information contained herein. Further, SageOne makes no representation, and it should not be assumed, that past performance is an indication of future results.
This note is for educational purposes only and should not be used for any other purpose. The information contained herein does not constitute and should not be construed as an offering of advisory services or financial products. Certain information contained herein concerning economic/corporate trends and performance is based on or derived from independent third-party sources. SageOne believes that the sources from which such information has been obtained are reliable; however, it cannot guarantee the accuracy of such information or the assumptions on which such information is based.