
October 28, 2015
Dear Investors,
In this newsletter we will look at the detailed performance analysis over the past 6.5 years and then I will present my views on the current valuations of the Indian markets as a follow up to the comprehensive valuation study we had done in September 2015. Here is the link to the study: September, 2015
Portfolio Performance*
Below is the gross (pre-fees but excluding dividends) performance of our core portfolio in INR terms for the last 6.5 years. The first three years have been managing proprietary funds and the last 3.5 years have been advising external clients. Since clients have joined at various stages, individual performance may differ slightly based on the timing of purchases. For uniformity and ease we measure our performance using a “representative” portfolio (that resemble advice given to clients) and we call it SageOne Core Portfolio (SCP). SageOne core portfolio is not a dummy portfolio but the CIO’s actual total equity portfolio.
6.5 Years Performance (April 2009 – September 2015)
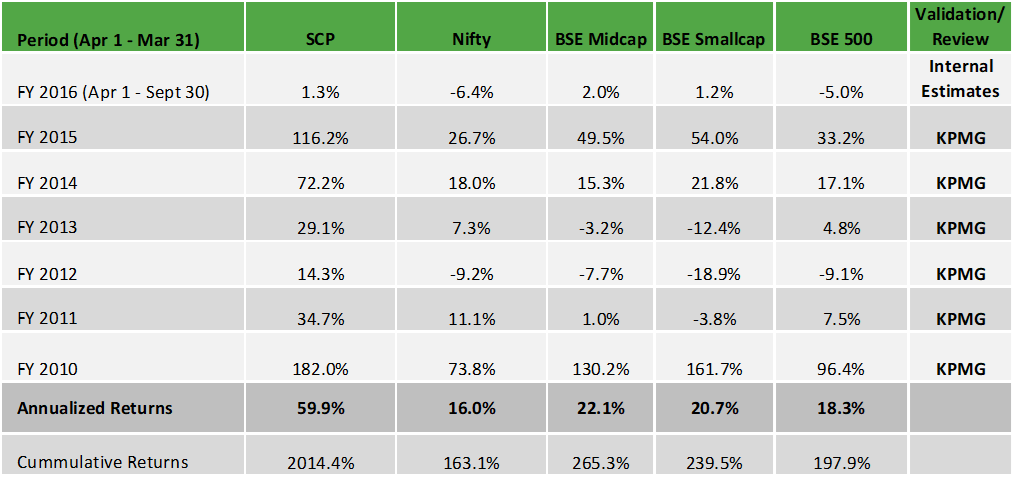
*We have consciously changed the composition of the core portfolio in terms of average size of companies and number of stocks in the portfolio after we started advising external clients in April 2012.
*The weighted average size of stocks at the start in FY10 was below $0.25 bn which has increased to near $1.7 bn by the end of September ’15. Also number of stocks have increased from 5 (+/- 2) in 2009 to 14 (+/- 2) during the past 3.5 years.
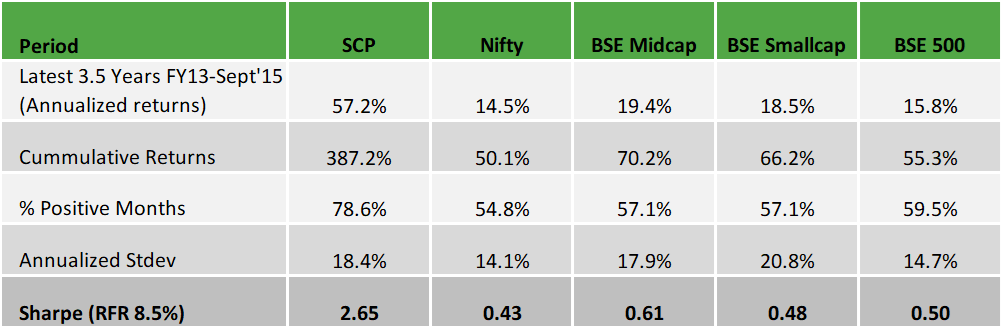
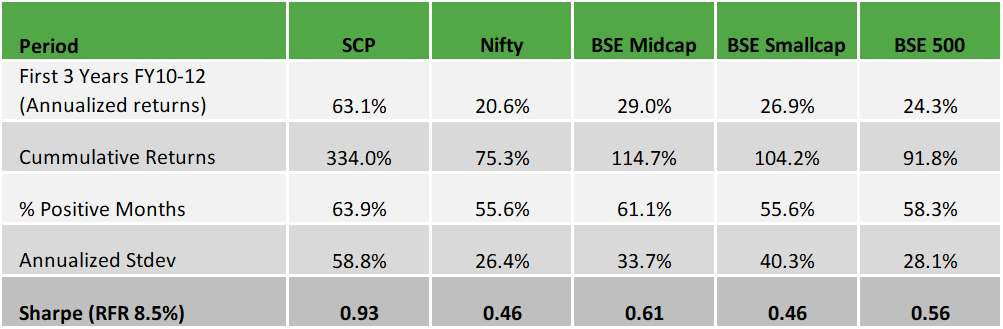
*Reasonable diversification was done by design to improve liquidity and reduce volatility as a result of which annualized standard deviation has come down from 59% for the first 3 years to 18% during the last 3.5 years.
Latest 3.5 Years Performance (April 2012 – September 2015)
First 3 Years Performance (April 2009 – March 2012)
The returns have been significantly above our expectations and we may not be able to replicate the same going forward. We have tried to do a broad attribution analysis of the returns especially for the past 3.5 years since we started advising external clients. Here is what we found:
→ Sales growth for the portfolio companies during this period has been little above 27%
→ Net profits (PAT) have grown at a higher rate of above 40% due to margin expansion
→ The returns are beyond the earnings growth due to valuation re-rating
Even though we are always on a hunt for businesses which would have all the three attributes listed above, our return expectations are mainly driven by the topline growth without expecting contribution from margin expansion or valuation re-rating.
View on Current Valuation for the Indian Stock Market
Valuation is often misleading when looked at from one dimensional and absolute level perspective. To get a better sense one needs to view at the absolute level of any particular valuation metric in combination with other parameters that can provide insight into the likely economic environment going forward. Of course predicting the future and especially the timing is risky and never easy, but history has told us that extreme conditions don’t last forever and there is a natural tendency for situations to return to a more sustainable levels. Look at the absolute levels of the trailing twelve month (ttm) PEx for the Indian market (557 company universe used in the valuation exercise) and the net margins over the past 14 years.
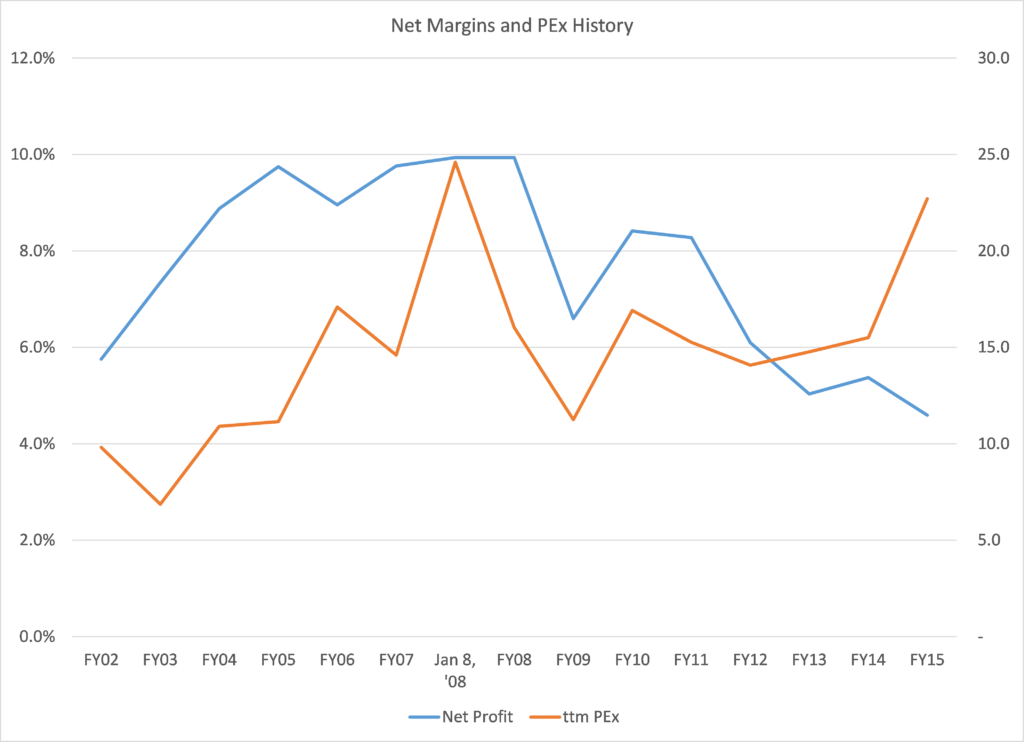
Source: AceEquity Database
At absolute levels, current ttm PEx of > 22x is close to the peak of near 25x reached in January 2008. But is the risk to valuation the same in both situations? When I am talking of valuation here, I am not referring to the multiples but prices which are driven by multiples as well as earnings. In 2008, the PEx as well as profitability were at all-time highs and the Indian market faced dual risk of not only the PEx contracting but also the Net Margins contracting to a more sustainable levels. Assuming that the PEx as well as margins would contract to the mean levels, PEx faced downside of 40% and Net Margins downside of 24% with combined downside risk of 55% which unfortunately for everyone more than played out. In contrast, 2002-03 had exact reverse scenario wherein both metrics were at cyclical troughs and probability of either one or both of them moving up was extremely high. Fortunately demand picked up which kicked in operating leverage and net margins jumped. As sales tripled from 2002 to 2008, net margins went up from 5.8% to 9.9%, and at the same time PEx jumped from below 10x to near 25x by January 2008 resulting in one of the biggest bull runs in India wherein market capitalization for the 557 company universe multiplied by more than 12x.
How does current environment stack up?
Current picture is a mix of 2003 and 2008 wherein the PEx is near peak and the net margins are at all-time low. PEx has factored in a lot of expectations from the new government and surely carries downside risk. If we assume mean reversion, we risk drop by 1/3rd. This can be offset by Net Margins improvement of 50%. If we assume Net Margins reverting to the mean of 7.5% (don’t believe this will happen very soon for reasons elaborated in the subsequent sections of this newsletter) from current trough levels of 4.6%, that’s an upside of 63% and above what’s needed to offset PEx risk. Key question is, what’s the sustainable net margin level and what’s the time frame to reach that level? Before we look into that, let us look at the factors that have impacted the current net margins.
What has depressed the net margins below average levels?
Current Net Margin of 4.6% is 2.9% below long term average of 7.5%. The key factors that have negatively impacted the Net Margins have been higher interest expense, lower other income (1.4% combined post tax impact) and higher operating expenses (1.6% post-tax impact) such as employee costs that have continued to grow at significantly higher rates when the sales growth has dropped to low single digits. Interest expenses are high mainly because of high leverage and interest rates in the country. Other Income is driven by the cash on the balance sheet, which is at the lower end and is also connected to the debt levels. Fixed cost have gone up as a % of sales as demand has slowed and capacity utilization has dropped to the lowest level taking down the EBIDTA margin by ~2% (pre-tax) from average.
Key Items (post tax) for Net Margin Drop
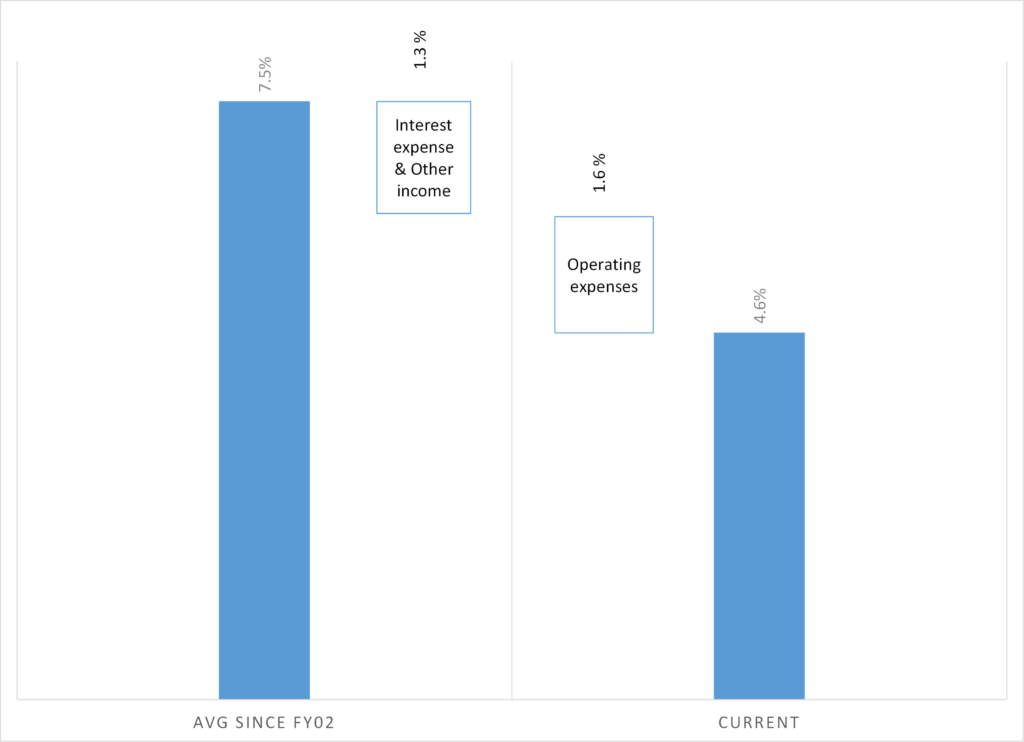
Source: AceEquity Database
Contrary to popular belief, low raw material prices haven’t had significant positive impact on margins over a sustained period. I believe this is because, most companies pass on the benefits of low prices to the consumer and very few have the pricing power to retain them. Now big question is what portion of this margin decay can be recovered and over what time frame. Before coming to that, let’s revisit last couple of upturns.
What happened during the last turn around?
During the FY02-03 turnaround the conditions were comparable in terms of high interest expenses not because of high leverage, but because of interest rate levels. Also capacity utilization levels were relatively low impacting EBIDTA margins. Demand started picking up in the second quarter of FY03 and increased by 14% during the last three quarters of that year. As interest rates started going down (drop of 3%+ in 2 years) and sales picked up, operating leverage kicked in with capacity utilization jumping from just above 80% to beyond 93% in 2 years. This resulted in Net Margins improving in a matter of 4 quarters from 6% in Q3FY02 to near 10% in Q2FY03. Net Profits improved by more than 50% when sales had risen by only 14% in that time frame. Similar swift jump in margins and profits were seen post 2009 downturn.
Comparison of Current Key Metrics with Previous Cycles
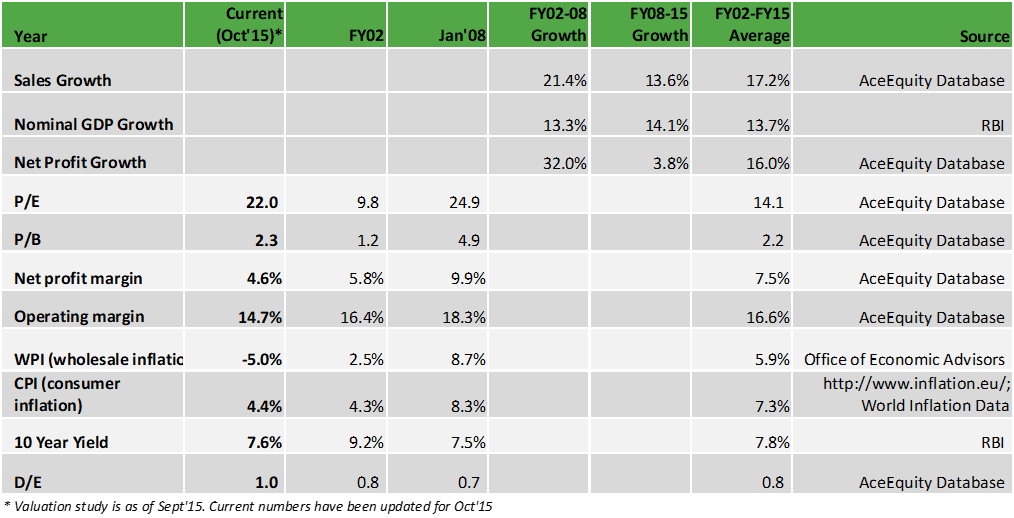
Can we expect such rapid improvement this time?
For us to have a repeat of 2003, we need favorable interest rate and demand environment. Currently we do have favorable interest rate trend supported by global deflationary environment and I am comfortable believing that interest expense as a % of sales would revert to mean over the next couple of years. What’s missing this time is the global easing cycle and demand trigger for sales to pick up. Add to that the deflationary pressures which impact the topline of corporates. When WPI (negative 4-6%) is negative, you can’t expect the sales to gain much momentum even if volumes pick up, and for such environment the current real interest rates are very high and a big burden for companies to get confidence in starting the investment cycle. Profitability and ROE is generally helped by under control inflation and I believe the deflationary and weak demand environment is a big risk to corporate India given that the capacity utilization is at the lowest levels in years.
Can Government alone take the burden?
Growth is driven by four spending wheels viz. Government, corporates, domestic and global. With three wheels punctured, this time the onus of triggering the demand environment is majorly on the Government. With parliament blockages even they are handicapped in the short to medium term. I have written very constructively on the Modi government in my last few newsletters and I am still as excited about the future of India under this new management over the long term. When the new management tries to change the corporate governance and the way capital is allocated (lesser subsidies and efficient capital expenditure) in such a complex country, it’s a fight against a system that has stabilized for many decades. The transition is going to be long and painful as creation and flow of unaccounted money is restricted. This unaccounted money which had very few investment avenues used to flow across India buying land or real estate, thereby providing not only cash but also giving a sense of wealth creation to the consumer as asset prices kept on ballooning. Now sudden break of this cycle is stopping cash flow as well has created reverse of wealth effect impacting spending patterns. This is extremely positive structural development for India in the long run, but disruptive in the short to medium term. We have seen the drastic slowdown in consumer demand as a result.
Stimulating Demand
The government has started the capex cycle in select sectors and this will create multiplier effect, but the trickle down would be slow and won’t be sufficient to cover the above slowdown over the medium term. Many companies including FMCG are passing on the commodity price benefits to consumers to retain market share and not to drive demand. As I write this newsletter, results so far this quarter indicate declining topline and margin gain for select few companies. This advantage won’t sustain for long until demand picks up. Along with government spending, corporates need to start their capital expenditure cycle after which consumer demand will pick up with some lag. Until government gets working majority in the Rajya Sabha, many key legislations that would help lift business confidence in the country would remain stuck. Without this confidence, low interest rates would be of little help.
Conclusion on Valuation
For me the key indication of over or under valuation is the level of investment returns expected over the next 3 to 5 years. In simple terms, if return expectations are below long term historical average, valuation is expensive and vice versa. The absolute valuations are surely expensive and there seems to be a consensus view amongst domestic and foreign investors that margins will improve as aggressively and quickly as in previous cycles to compensate for any PEx contraction. I believe, the time expectation is where the risk to the market valuation is as investors lose patience and faith in the government by the time significant improvements are visible.
In the performance section above, I have listed 3 factors affecting returns viz. topline growth, margin expansion and PEx rerating. Probability of PEx rerating is remote from the current levels. On the contrary, there is a risk of derating to average level as mentioned before. I believe that the deflationary environment will be a drag on the topline growth as well as the net margins until demand picks up and capacity utilization increases from the current < 70% to average level of around 85%. PEx won’t sustain at these levels for long. Best case would be that the PEx contraction would be offset by margins expansion. In such a scenario, returns would depend majorly on sales growth, which has historically been close to the nominal GDP growth. The muted inflationary environment would be a strong head wind for the nominal GDP growth to surpass historical average of 14%. Needless to say my returns expectations for the broader market are at similar level over the next 2 to 3 years and well below historical average of 16-17%.
Having said this for the broader economy, given the trough cyclical margin environment, there are huge opportunities to pick sectors and stocks within those that have the above three factors in their favor.
Our Portfolio Strategy
If one carefully analyses the results of the valuation study, there are few sectors where the probability of mean reversion is very high for PEx as well as net margins. I believe the next 12-18 months are going to be tough, but these sectors would provide great opportunity to find businesses which would have all the 3 factors I have listed above and would drive future investment returns. Even when economy picks up, one needs to be careful to bet on very obvious choices. E.g. government spending on road construction doesn’t mean that investors will generate wealth by investing in road builders. We would stick to businesses who have pricing power, huge barriers to entry and are indirect plays on the sectors seeing favorable environment because of government or other spending.
Warm Regards,
Samit S. Vartak, CFA
Chief Investment Officer (CIO) and Partner
SageOne Investment Advisors LLP
Email:sv@SageOneInvestments.com
Website:www.SageOneInvestments.com

*SageOne Investment Advisors LLP is registered as an Investment Advisor with SEBI.ered as an Investment Advisor with SEBI.
For annexures, please download the PDF.
Legal Information and Disclosures
This note expresses the views of the author as of the date indicated and such views are subject to changes without notice. SageOne has no duty or obligation to update the information contained herein. Further, SageOne makes no representation, and it should not be assumed, that past performance is an indication of future results.
This note is for educational purposes only and should not be used for any other purpose. The information contained herein does not constitute and should not be construed as an offering of advisory services or financial products. Certain information contained herein concerning economic/corporate trends and performance is based on or derived from independent third-party sources. SageOne believes that the sources from which such information has been obtained are reliable; however, it cannot guarantee the accuracy of such information or the assumptions on which such information is based.