
Dear Investor,
2020 was a historical year with wild oscillations in the markets and sentiments seldom experienced before. It was a humbling experience for the bulls as well as the bears. Globally markets were at elevated valuation levels at the start of 2020. At such levels, imagine if investors were told exactly how the global economies will do over the upcoming 9 months and given a choice to stay invested or get on the sidelines. I am certain that almost everyone would have picked the second option, but look at where we are now. Depending on how the global moving parts (central banks, politicians, public, etc.) react to an event, can drive the markets in completely opposite directions compared to the economies. Predicting their behavior is an impossible task. More on this fascinating aspect later. First let me briefly cover how CY2020 was for us.
SageOne Portfolio Performances for CY 2020
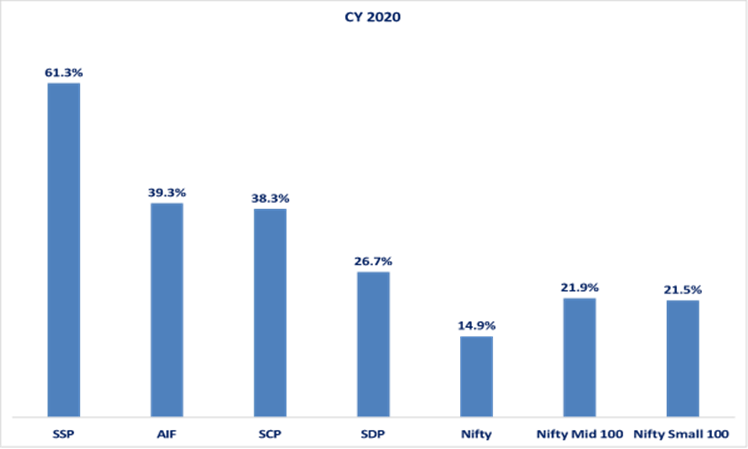
Rising tide lifts all boats and that included our portfolios. In CY 2020, (Jan-Dec) majority of our portfolios delivered significant Alpha during the year against their comparable indices, but our small/micro-cap portfolio (SSP) stood out delivering the best returns at +61.3%, an alpha of ~ 40% against the Nifty small cap 100 index. More importantly the drawdown in March’20 was much lower for SSP at -24.5% vs -36.7% for the Nifty small cap 100 index. This portfolio also received # 1 Rank from the domestic performance aggregator PMS-AIF world for CY 2020 absolute returns across all categories of PMSs in India.
Looking back, we really feel good about strongly recommending our investors to invest in SSP when we launched this portfolio in early 2019, at a time when this space was hated and provided extremely attractive valuations. More than just the % returns, it’s important that investors make absolute wealth and many of our investors allocated significant incremental capital during the downturn. Overall across portfolios, what gives us the most satisfaction is that they outperformed during the downtrend/crash. Below are the return for our portfolios in CY 2020. Detailed tables are provided in the Appendix at the end.
Understanding Mr. Market
Last year reminded us again how difficult it is to understand the nature of the stock markets. In today’s world, we are overloaded with data which is disseminated and factored in very quickly. Human mind thinks analytically and while it’s highly effective in understanding businesses, it’s ineffective in understanding markets. A book by Robert Hagstrom “Investing: The Last Liberal Art” is very insightful on the subject of understanding this aspect.
Physics is the science that investigates the matter, energy, and interaction between them – the study, in other words, of how our universe works and stays in equilibrium. Equilibrium is not only the backbone for classical economics, but it also serves as the foundation for modern portfolio theory. Scientists are questioning this simple system, which has very few interacting parts and even those are static. Scientists at the Santa Fe Institute are now studying complex adaptive systems – those systems with many interacting parts that are continually changing their behavior in response to changes in the environment. Examples include the central nervous system, ecologies, ant colonies, political systems, social structures, and economies. To this list now they are adding the stock markets.
Every complex adaptive system is actually a network of many individual agents all acting in parallel and interacting with one another. The critical variable that makes a system both complex and adaptive is the idea that agents (neurons, ants, or investors) in the system accumulate experience by interacting with other agents and then change themselves to adapt to a changing environment. If a complex adaptive system is, by definition, continuously adapting, it is impossible for any such system, including the stock market, ever to reach a state of perfect equilibrium that can be predicted.
When the COVID pandemic hit us hard in March’20, investors panicked and rushed out of the door causing a market crash. Post that the world responded in a coherent and urgent manner to tackle the pandemic and economic situation, causing the markets to bounce back (and much more) like never seen before. With this new observation, markets’ reaction to a similar event in the future could be very different. You should not be surprised even if the markets actually go up anticipating actions by the moving parts.
The market and the economy are best understood from a biological perspective: especially Darwin’s evolution theory. If you use static laws of physics or mathematical formulae, you would almost always go wrong as markets are way smarter than that and would have moved to secondary (or higher multiple) order effects. That’s the reason when a particular strategy attracts enough herd, it stops working. During the COVID market bounce when the indices had retraced 2/3rd of the fall, there were many experts across the globe providing historical statistics of how markets always turn back from here. It was so widely believed that probably many positioned for it well in advance and the markets just blew past all those levels like a rocket.
“This Time It’s Different”
As Sir John Templeton said, these are the most dangerous four words in the stock markets. It doesn’t mean that the markets will react to the same set of events in the same manner. In fact it’s almost impossible to repeat because market participants (as a combined force) are too smart and predict reaction well beyond such repeating events. At the same time the regulators and government agencies are better prepared in handling the risk the second time. What doesn’t change is people’s behavior under Greed and Fear. It helps significantly more to analyze/predict people’s behavior if similar set of events play out compared to analyzing the repeating event.
The previous big global crash before the recent COVID crash was the financial crisis in 2008. With fresh memories (recency bias) of the brutal crash, it’s natural that investors would worry about this risk the most. Many experts including the legends such as Howard Marks and Jeremy Grantham have been warning of the risks of increasing global debt and money printing since 2011. It’s possible that this risk will play out one day, but it playing out when most market participants are well aware of it is extremely unlikely. Most likely the next crash will be from a risk which we are ignorant about or are unaware of.
Currently with markets and economies in opposite sentiments, one can put together strong arguments for both bull or bear case. How exactly will it play out, is again beyond our predicting ability.
I am bullish on India and the markets and the reasons will be clear when you read through (in the upcoming sections of this memo) my micro analysis of corporate India and few thoughts on the recent budget. On the macro front let me try and put together strong macro arguments “For” as well as “Against” a Bull case for the Indian markets. Depending on your bias, you can get convinced of either. I will leave my conviction to be driven by the micros. Let me start with “For”:
→ Government focusing on growth. They are getting aggressive with reforms, spending, privatization, divestments, and incentive policies to make India a global manufacturing hub.
→ World post Trump will be go back to globalization and funds which had over allocated to (trade protected) US markets will reallocate them to the emerging markets (EMs) thereby benefiting India. Note that US equities are currently ~40% (i.e. $40 tn) of the world equities in terms of market value (i.e. $100 tn). They were below 30% when the uptrend started in 2008.
→ Dollar index has reversed its 10 year bull run and EMs do extremely well during a weak dollar environment. I had presented an analysis specific to India in my last memo.
→ India’s corporate profits as a % of GDP will mean revert from the 1.8% for FY20 towards the previous high of 7.8% reached in FY08. This means tremendous earnings growth over the next few years.
→ Global equity value as a % of total financial stock (Source: Credit Suisse) is only at around 25% compared to 38% reached in 1999. So even though equities may seem expensive in terms of PEx or as a % of GDP, they are not expensive (or even cheap) vs other financial asset classes.
→ Low inflation, low bond yields and easy liquidity environment will continue across the globe for a long time to come and will support equities.
→ Post Trump disruption, global investment cycle will pick up thereby reviving GDP and earnings growth in which India will be a big beneficiary.
→ EM equities have been flat since 2008 and have crossed previous highs after a gap of 12 years. Now it’s time for them to mean revert and significantly outperform the US markets similar to how they did in the 2004-08 period.
→ Corporate India has deleveraged and has the strongest balance sheet in history. They are poised for growth.
→ Indian investors are carrying very little leverage compared to previous bull markets as the regulator has considerably tightened margin norms.
“Against”:
→ Nifty valuations are at all-time highs and hence such levels are unsustainable. Current Nifty valuations at > 3x of the levels in 2003 when the previous bull cycle had started.
→ Recent earnings momentum is temporary in nature and there is no proof of it being structural or sustainable. In the meantime FOMO and Greed has gripped the investors as they are extrapolating this trend and are driving the already astronomically high valuations even higher.
→ Government has promised multiple times but have fallen short on execution. That might repeat even after a strong budget and promise.
→ Banking system is still under stress and hence credit growth will be extremely difficult. GDP and hence earnings will struggle to grow without credit growth.
→ World is sitting on the highest level of debt/GDP ratio and inflation as well as bond yields have started picking up. Higher bond yields will act as strong gravity for the market valuations as well as levels.
→ There is too much leverage in the system globally thereby inflating asset prices to never seen levels. Rising bond yields will finally force deleveraging and trigger the vicious cycle of falling asset prices and eventually a market crash.
Even though I am on the “For” side, I would not build the portfolio believing that the bull case will play out. Portfolios can’t be built based on hope. Time is much better spent on evaluating individual companies as their analysis is much more suited to our analytical minds.
Let me move on to the current environment in India and also provide some views on the budget announcements.
Budget and Government Actions under Crisis
It has been relieving to see that the government has shown urgency in pushing multiple reforms (labor, farm, land, tax, privatization, divestment, attracting FDI, export incentives, etc.) when pushed to the wall. Who would have thought that post COVID, a high fiscal deficit (even double digit) will no longer be a concern for the rating agencies or bond yields. This has given immense flexibility (missing in previous budgets) to the finance minister to go for a growth oriented budget without burdening the rich with taxes.
Growth – Need of the Hour
I don’t want to overload you with more thoughts on the budget. Best thing is that there was no negative shocker that would hamper the growth or dampen the reviving animal spirits. Budget was continuation of the growth steps that the FM has taken over the past 18 months, starting with the corporate tax cuts, low income taxes on new manufacturing units and PLI schemes. There is no better time and appetite to divest and privatize PSUs (public sector units) and this time finally it looks very likely to happen. I believe it’s important to track the actions/execution by the government very closely rather that reacting preemptively just based on the announcements. Execution is the key and the government’s intent seems to be high.
Has a New Bull Phase Started? Is it 2003-07 or 1991-92 or 1999-2000?
There are too many moving parts across the globe for any cycle to repeat itself. I am not even going to try and predict if we are at a start of a new bull cycle nor am I going to attempt to compare it with previous ones. What I want to present you with are few fundamental parameters for corporate India that are strikingly at levels never seen before. There could be some at levels seen at the bottom in 2003, but that doesn’t mean we would see that cycle repeating. That was a global cycle and needs too many variables to align which is extremely difficult to predict. In addition, in India (2003-07) we had a very loose lending environment and the appetite for risk was very high. All such factors aligning would be difficult when our banking system is very careful and just emerging from the worst stress. There could be a bull cycle emerging but it most likely would be of a very different nature with very different industries benefiting.
For the roughly 75% of the companies who have reported earnings for Dec’20 quarter, the median earnings growth (against same period of LY) for 9 months ended Dec’20 is around zero. In fact the total earnings growth (vs Median) is > 20% mainly due to the banking sector. That’s incredible given what we have gone through. Beyond this, the micro analysis that I am presenting now makes me very positive and hopeful about listed corporate India. Top hundred listed companies (large caps) tend to be strong and hence I am presenting this analysis for the next roughly 600-700 companies for each of the past 16 years. Directionally even large caps show similar trend, but the improvement for mid/small caps is more striking.
Median for Mid/Small Caps (as of quarter ended Sep’20)
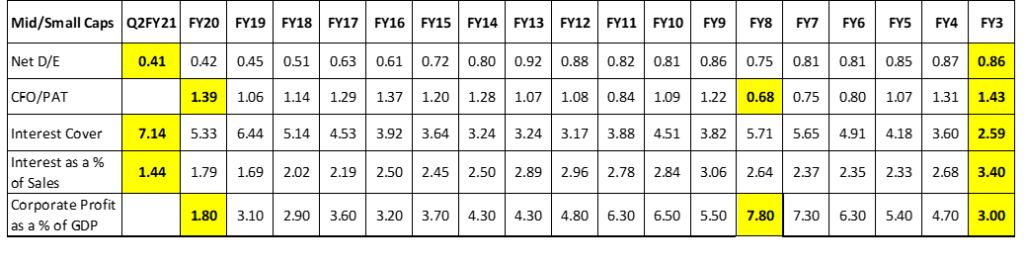
Source: Ace Equity
→ Net D/E levels at lowest levels probably in modern history. This should improve further by March end.
→ Cash flow from operations (CFO) as a % of Profits after Taxes (PAT) at highest levels since 2003 and at double the levels of FY08. Hence comparing valuation multiples like P/E of today vs 2008 is unfair.
→ Corporate profits as a % of GDP is at the lowest levels compared to anytime at in this century.
→ Current interest cover and interest as a % of sales at best levels in this century.
We can clearly see that corporate India has used this crisis to optimize their cost structure and strengthen their balance sheet. India is fortunate to have various promoters who have survived through multiple shocks and emerged over the past decade much stronger and ready to take on the global competition. I believe, with help of the government incentives and reforms, they will get an easier environment over the next few years to become global players and we are excited to bet on some of the proven executioners. We will continue to closely track ground level changes and accordingly align our portfolio towards new trends and growth opportunities across industries. While economic cycles are difficult to predict and unreliable to ride on to create wealth, we believe that great executioners and high growth businesses can be relied upon to deliver.
Warm Regards,
Samit S. Vartak, CFA
Founder and Chief Investment Officer (CIO)
SageOne Investment Advisors LLP
Email: ir@SageOneInvestments.com
Website: www.SageOneInvestments.com

*SageOne Investment Advisors LLP is registered as a PMS and an AIF with SEBI.
Appendix – 1
SSP Portfolio* Performance (Net of Fees)
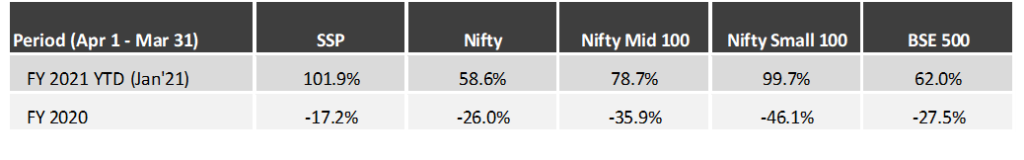
Source: SageOne Investment Advisors, Bloomberg, Wealth Spectrum
*SSP (SageOne Small&MicroCap Portfolio) portfolio is composed of 12-20 stocks with Mcap ranging from 500 cr to 5000 cr at entry. This scheme was launched last year. Average Map as of Jan 31, 2021 was 4,700 cr
SDP Portfolio* Performance (Net of Fees)
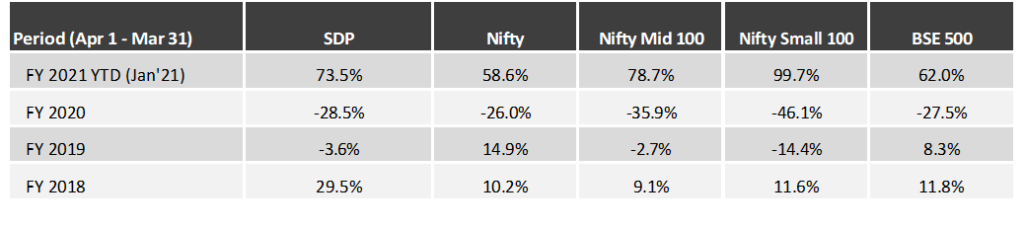
Source: SageOne Investment Advisors, Bloomberg, Wealth Spectrum
*SDP consists of 22 equal weighted stocks as of Jan 31, 2021. Average Mcap 13,000 cr
SageOne Core Portfolio (SCP) Performance (Net of Fees)
For the first three years, we managed proprietary funds and for the last 8 years and 10 months, we have been advising/managing funds for external clients. Since clients have joined at various stages, individual performance may differ slightly based on the timing of purchases. For uniformity and ease, we measured our IA performance using a “representative” portfolio (that resembles advice given to clients) and we call it SageOne Core Portfolio (SCP). SageOne core portfolio is not a dummy/theoretical portfolio but the CIO’s actual total equity portfolio. The representative portfolio until FY17 was reviewed by KPMG. Post that the performance is for the PMS scheme. Calculated on a TWRR basis for the entire period.
11 Years 10 Months Performance in INR (Apr 2009 – Jan 2021)
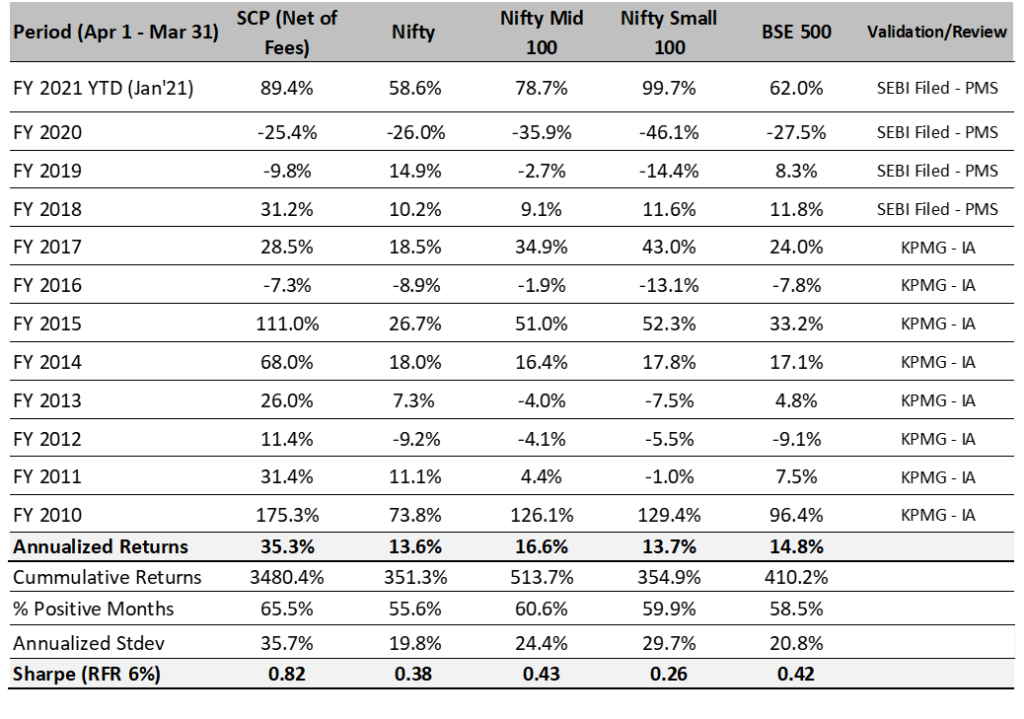
Source: SageOne Investment Advisors, Bloomberg, Wealth Spectrum
* SCP consists of 15 stocks as of Jan 31, 2021. Average Mcap 13,900 cr
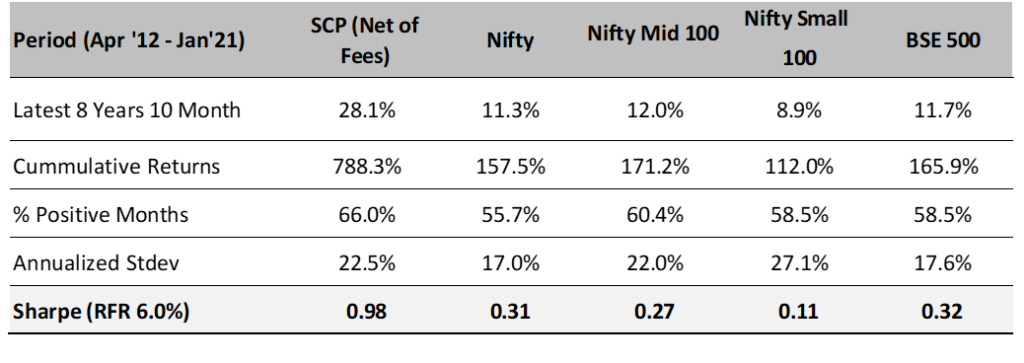
SCP: Latest 8 Years 10 Months Performance (Apr 2012 – Jan 2021)
SCP: First 3 Years Performance (Apr 2009 – Mar 2012)
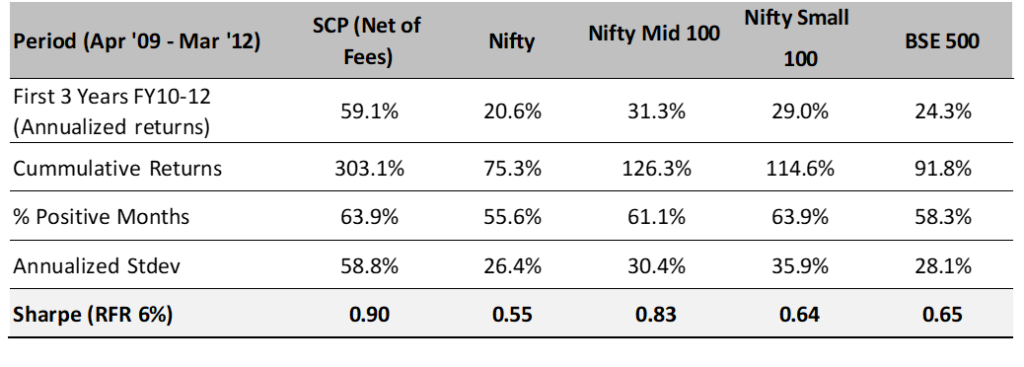
*We have consciously changed the composition of the core portfolio in terms of the average size of companies and the number of stocks in the portfolio after we started advising external clients in April 2012.
*The weighted average size of stocks at the start in FY10 was below $0.25 bn which has increased to nearly $2.00 bn by the end of Jan ’21. Also, the number of stocks has increased from 5 (+/- 2) in 2009 to 14 (+/- 2) during the past 8 years and 10 months.
*Reasonable diversification was done by design to improve liquidity and reduce volatility as a result of which annualized standard deviation has come down from 59% for the first 3 years to 23% during the last 8 years and 10 months.
Legal Information and Disclosures
Any performance related information provided above is not verified by SEBI.
This note expresses the views of the author as of the date indicated and such views are subject to changes without notice. SageOne has no duty or obligation to update the information contained herein. Further, SageOne makes no representation, and it should not be assumed, that past performance is an indication of future results.
This note is for educational purposes only and should not be used for any other purpose. The information contained herein does not constitute and should not be construed as an offering of advisory services or financial products. Certain information contained herein concerning economic/corporate trends and performance is based on or derived from independent third-party sources. SageOne believes that the sources from which such information has been obtained are reliable; however, it cannot guarantee the accuracy of such information or the assumptions on which such information is based.