
Dear Investor,
I have written this memo much sooner than my regular quarterly frequency as there have been many questions from the investors on whether this is the right time to get into/out of, increase/decrease allocation in the small/mid cap space given the sharp run up since March 2020. Add to that the latest SEBI circular on re-categorization of the multi-cap mutual funds. I am not an authority on timing and most probably whatever I speculate on that aspect will turn out to be wrong, hence I won’t try and provide my views but just present some relevant analysis that may help answer some questions. Before that a short commentary on our performance.
SageOne Portfolio Performances
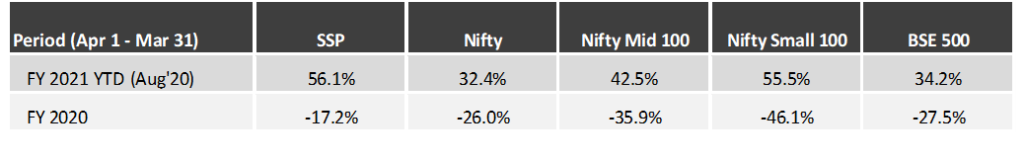
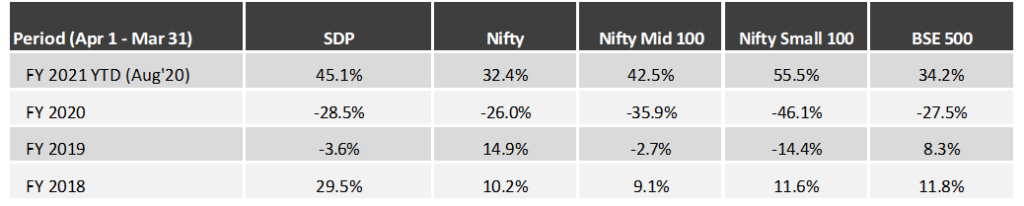
With the small cap space doing relatively well, our SageOne Small/Micro-cap portfolio (SSP) has delivered 56.1% absolute returns this fiscal year (i.e. April 1 – Aug 31, 2020). Our mid/small cap portfolios SageOne Core Portfolio (SCP) and SageOne Diversified Portfolio (SDP) are also up 50.1% and 45.1% respectively during this period. Detailed performance is presented in the annexures. We would not take much credit for this short-term performance as rising tide lifts all boats and we were one of them. This environment reminds me of Howard Marks’ words in his October 1998 memo:
“Never confuse brains with a bull market.” When the 1990s began, the economy and the stock market were at very low levels. As a result, success came easily, risk-bearing paid off and the highest returns often went to those who took the most risk. They and their strategies were accepted as the best. In my opinion, (a) the three ingredients behind success are timing, aggressiveness and skill, and (b) if you have enough aggressiveness at the right time, you don’t need that much skill. But those who have attained their success primarily through well-timed aggressiveness can’t be depended on to repeat it — especially in tough times. When an investment track record is considered, it’s essential that the relative roles of these three factors be assessed”
In this memo, I have focused mainly on analysis of the SEBI triggered potential impact and an interesting analysis of Indian equity market performance correlation with the USD/INR exchange rate.
SEBI Re-Categorization of Mutual Funds
SEBI had done a big re-categorization of mutual funds (MFs) in early 2018 which triggered initial rotation from small/midcaps to large caps, and the falling prices created their own snowball effect resulting in the small cap universe correcting by > 65% by March 2020 from its peak in January 2018. During this period the large cap indices delivered positive returns.
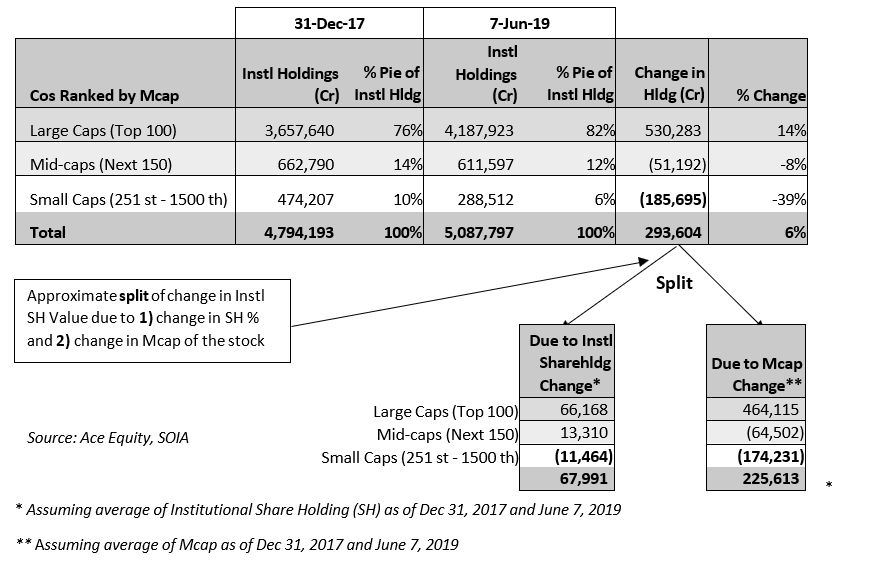
In the latest re-categorization of multi-cap MFs, a small part of the 2018 action is proposed to be reversed. I had presented a detailed analysis on this topic in my Jun’19 memo. For everyone’s easy reference, let me reproduce the summary in a table.
How has the Institutional SH evolved after the above?

Observations from the above tables and input data:
→ Institutional shareholding (SH) in large cap space is currently 20% above the Dec’17 levels whereas it’s 41% lower for the small cap space. The total institutional SH value has increased by 10% during this period
→ Small cap companies make up 10% of the total market capitalization, but the institutional SH is only at 5.3% of their total holding
→ In Dec’17 small cap companies made 16% of the total market capitalization. Biggest contribution in the market drop was the forced selling by the domestic institutions. As prices dropped, it forces other investors to move out and seek performing asset classes such as the large caps.
Can the latest SEBI re-categorization help the small cap space?
The estimates by various analysts and brokerage houses indicate that the net inflow from large caps would be around INR 27,000 cr into the small caps and around INR 13,000 cr into the mid caps. Now whether MFs actually do the entire re-allocation or whether they merge their multi cap schemes into the large cap schemes is an unknown. My understanding is that even though this seems theoretically easy, it’s very difficult to execute by the deadline of January 31, 2021. In addition, MF may face redemptions by announcing merging of the schemes and basically changing the product.
Irrespective of the amount that actually gets re-allocated, just the anticipation could bring in fresh capital in small/mid cap schemes under MFs, PMS’ and AIFs. It doesn’t take much inflow to move stocks in this universe. As I had presented in the Jun’19 memo, the impact cost of actual exits was as high as 15x in the small cap space. This means that if one was to invest fresh capital of INR 1,000 cr in the small cap companies, on an average their market cap would go up by INR 15,000 cr. There will not be enough sellers available when the expectation is that this space would do well in presence of forced buyers. This typically is experienced in a “short squeeze”.
Even if we assume that only half (INR 13,500 cr) the capital would be re-allocated by the MFs and assume that there will be no fresh inflows in the small cap companies by other investors and in addition even if we assume that the buying impact would be half (7.5x), the increase in the market cap of the small cap universe would be more than INR 100,000 cr which is around 36% increase in total market cap (currently INR 280,000 cr) of the small cap companies. Even with this jump, the small cap institutional holding will be still 20% below it’s Dec’17 level.
More importantly, this SEBI step would benefit more than 1000 companies compared to just 100 companies that benefited by the 2018 circular. In an environment when debt raising is multiple times difficult for the smaller companies, this SEBI triggered change would help equity raising capability of these companies. Awakening animal spirits is a need of the hour for our country and economy and the above numbers don’t indicate anything that in unfairly biased towards the small cap universe.
Correlation of USD/INR Exchange Rate and Indian Equity Indices
Indian equity markets have done well during strong/stable INR against the USD. Even with this broad knowledge, the results of the analysis are shocking.
Data for Period April 1, 2003 to August 31, 2020

As you can see, equity performance is directly correlated to the INR performance against the USD. During months when INR has appreciated by more than 1%, the annualized performance of Sensex, BSE Midcap and BSE Small cap indices has been 76%, 102% and 99% respectively. Comparable annualized performance when INR depreciated by more than 1% during a month has been -20%, -27% and -37% respectively for the same indices. Also if you break up various periods during the last 18 years (small/mid cap indices data not available beyond that), this is how the performance correlates.
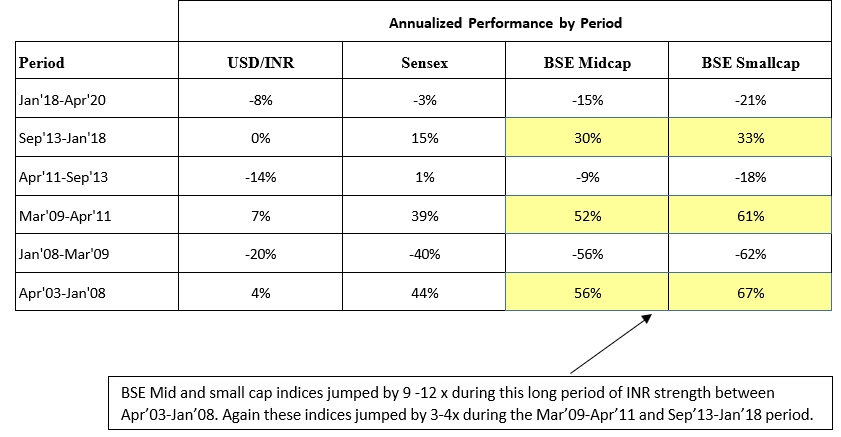
INR performance is also correlated to the Dollar Index, which keeps on oscillating between 75 and 120. This time it has reversed from 103 and currently at 93. If history repeats itself and it continues its downward trend towards 75, the mid and small cap indices could continue their upward trend. In many of these trending cycles (highlighted above), initially these indices bounce without any reasons. Simple reasons could be that the sellers are exhausted and the supply demand balance reverses. The fundamental reasons emerge later to fill in the blanks. Even in the current rise, investors have been struggling to connect the market rise with the reality on ground. In the meantime as Dollar index weakened, RBI had to buy USD to keep INR from rising too quickly.
Now this could be looked at as just a technical relationship, but a stable INR could also be a fundamental solution for our current situation/problems. Currently our fiscal and the banking system is under stress. If INR was a reserve currency like the USD, RBI could have easily expanded (printed money) our balance sheet without fear of currency crash. The weak Dollar and race to print money across the world provides big cushion for us to be able to do it at our end. I am not saying this will be opted for, but this cushion surely is a big fundamental change for India that has occurred over the last 6 months.
I have seen many corporates trying to raise equity and reduce debt. Even with COVID related incremental stress, the median D/E for non-financial companies has fallen from 0.36x in FY18 to 0.32x in FY20. I believe that the quality of balance sheets of Indian corporates has improved even when the perception is poor about our banking system. This will bode well when the credit cycle improves and economy gets back to normal.
Our Strategy
Even though both these factors are significant triggers for the non-large cap space, I want to emphasize that the above is just a hypothesis based on assumptions that may not play out. SEBI could decide to take this back upon strong representation by the MF association or INR could crash when some unknown risks emerge. The above factors are good to have, but should not be dependent conditions for portfolio company selection. Our strategy remains the same of investing in high and sustainable earnings growth stories that are not commonly known to the markets.
Our SSP comprises of 100% small cap companies while our SCP/SDP portfolios have 60% allocation to small caps and 35% to mid caps. The allocation has nothing to do with above factors, but purely based on the mandate and parameters we look for in our portfolio companies. Sometimes the external environment is favorable for valuations and is a welcome change after going through a long adverse period.
Warm Regards,
Samit S. Vartak, CFA
Founder and Chief Investment Officer (CIO)
SageOne Investment Advisors LLP
Email: ir@SageOneInvestments.com
Website: www.SageOneInvestments.com

*SageOne Investment Advisors LLP is registered as an Investment Advisor, PMS and AIF with SEBI.
Appendix – 1
SSP Portfolio* Performance (Net of Fees)
Source: SageOne Investment Advisors, Bloomberg, Wealth Spectrum
*SSP (SageOne Small&MicroCap Portfolio) portfolio is composed of 12-20 stocks with Mcap ranging from 500 cr to 5000 cr. This scheme was launched last year. Average Map as of Aug 31, 2020 was 3,700 cr
SDP Portfolio* Performance (Net of Fees)
Source: SageOne Investment Advisors, Bloomberg, Wealth Spectrum
*SDP consists of 22 equal weighted stocks as of Aug 31, 2020. Average Mcap 10,100 cr
SageOne Core Portfolio (SCP) Performance (Net of Fees)
For the first three years, we managed proprietary funds and for the last 8 years and 5 month, we have been advising/managing funds for external clients. Since clients have joined at various stages, individual performance may differ slightly based on the timing of purchases. For uniformity and ease, we measured our IA performance using a “representative” portfolio (that resembles advice given to clients) and we call it SageOne Core Portfolio (SCP). SageOne core portfolio is not a dummy/theoretical portfolio but the CIO’s actual total equity portfolio. The representative portfolio until FY17 was reviewed by KPMG. Post that the performance is for the PMS scheme. Calculated on a TWRR basis for the entire period.
11 Years 5 Month Performance in INR (Apr 2009 – Aug 2020)
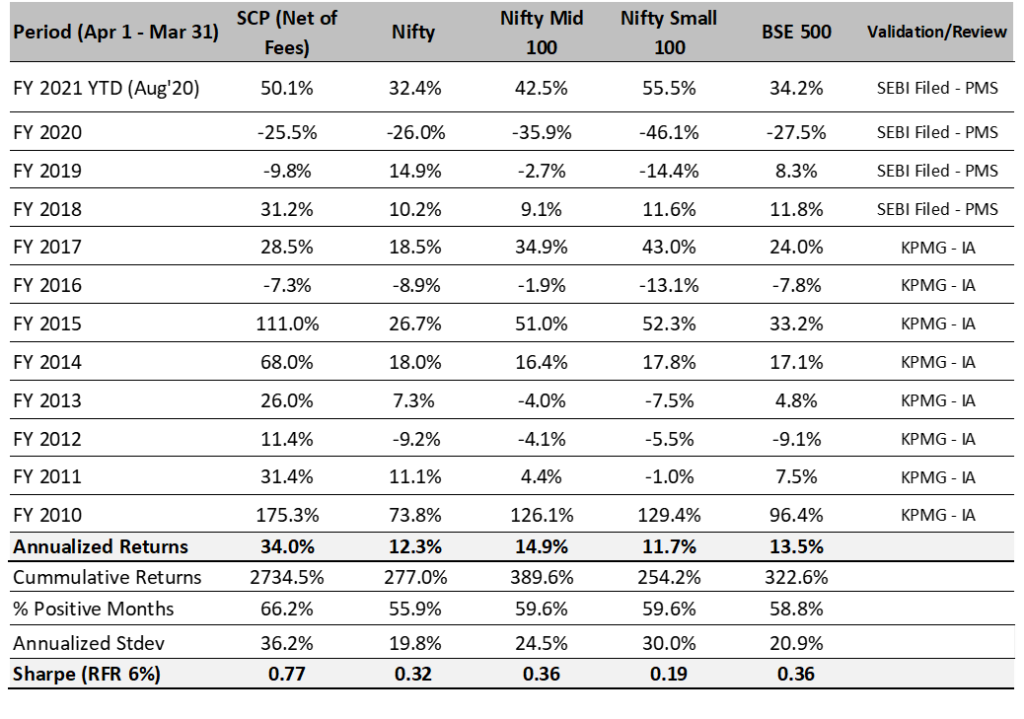
Source: SageOne Investment Advisors, Bloomberg, Wealth Spectrum
* SCP consists of 15 stocks as of Aug 31, 2020. Average Mcap 12,300 cr
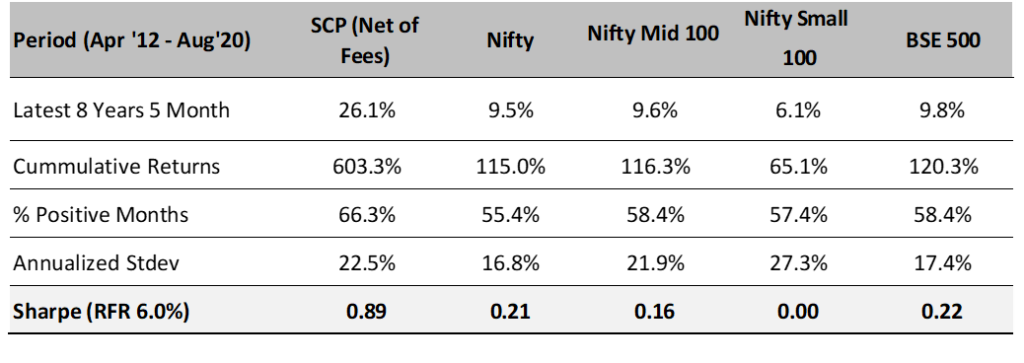
SCP: Latest 8 Years 5 Month Performance (Apr 2012 – Aug 2020)
SCP: First 3 Years Performance (Apr 2009 – Mar 2012)
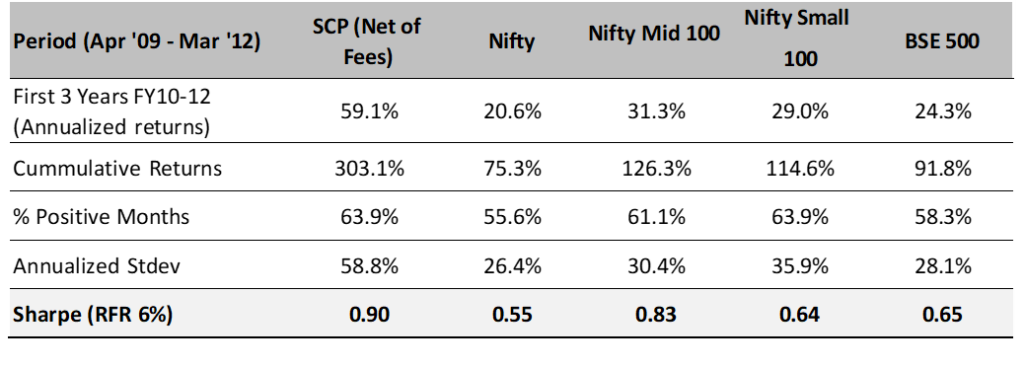
*We have consciously changed the composition of the core portfolio in terms of the average size of companies and the number of stocks in the portfolio after we started advising external clients in April 2012.
*The weighted average size of stocks at the start in FY10 was below $0.25 bn which has increased to nearly $1.67 bn by the end of Aug ’20. Also, the number of stocks has increased from 5 (+/- 2) in 2009 to 14 (+/- 2) during the past 8 years and 5 months.
*Reasonable diversification was done by design to improve liquidity and reduce volatility as a result of which annualized standard deviation has come down from 59% for the first 3 years to 22% during the last 8 years and 4 months
Legal Information and Disclosures
Any performance related information provided above is not verified by SEBI.
This note expresses the views of the author as of the date indicated and such views are subject to changes without notice. SageOne has no duty or obligation to update the information contained herein. Further, SageOne makes no representation, and it should not be assumed, that past performance is an indication of future results.
This note is for educational purposes only and should not be used for any other purpose. The information contained herein does not constitute and should not be construed as an offering of advisory services or financial products. Certain information contained herein concerning economic/corporate trends and performance is based on or derived from independent third-party sources. SageOne believes that the sources from which such information has been obtained are reliable; however, it cannot guarantee the accuracy of such information or the assumptions on which such information is based.