
Dear Investor,
Indian equity markets have scaled all-time highs with virtually no correction in the last 17 months. Since 1991, we have had 20 years (2/3rd probability) during which the Sensex corrected by more than 15% from the peak. I am sure there will be such correction someday, but whether it will happen next week or after 5 years, no one really knows. Strategies such as waiting for corrections or booking profits early and expecting to re-enter at lower levels have not worked. The Nifty small cap 100 index has risen by more than 230% from the bottom in Mar’20, but note that it has barely recovered the 67% fall it went through from the peak in Jan’18. We will only know in hindsight that we were in a long bull market and if you aspire to ride a full upcycle, expect the markets to tempt and scare you out multiple times with sharp rises and corrections. Most who get out, will find it extremely difficult to get back in as the re-entry most likely will have to be at much higher levels.
In my Aug’17 memo, I had presented an interesting analysis on Sensex returns for the period 1979 to 2017. During the 38 years, Sensex had risen by 251x and if you missed the best 1% days, your returns would have been ZERO. That’s how concentrated the returns typically are across global markets and many of those best days are in a bull cycle which are costly to miss.
In my previous memos, I have written in depth about the market and economy disconnect and why that seeming irrationality has a lot of logic. In this memo I want to introduce one more analysis that surprised me and may surprise you too. Before that, let me briefly talk about our portfolio performance.
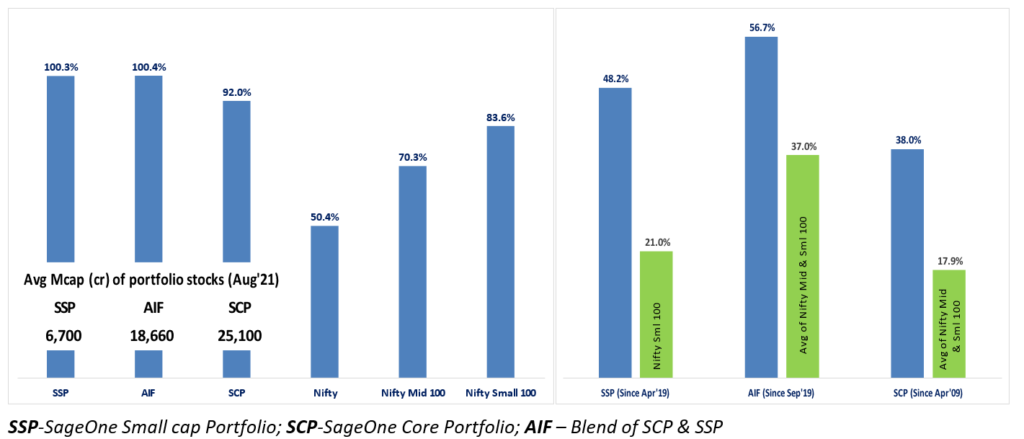
Our portfolios have bounced back sharply, 3.1x for SCP (mid & small cap) to 3.5x for SSP (small cap), from the lows of the March ‘20 crash. Our relatively lower drawdowns during the falls and this jump has enabled us to continue outperforming the benchmarks significantly as represented in the below graphs.
SageOne 1-Yr and ‘Inception to Date’ Performance (Net of Fees)
Since the lows in Mar’20, we have had a relentless bull rally. Often in such rallies, the higher risk you take, the higher returns you make. Out of nearly 5,000 companies listed on the BSE, even if you consider the largest 1,600 companies and analyze the performance from the lows of Mar 23rd 2020 to the recent 52 week highs, the results are stunning. 85% of the stocks outperformed the Nifty 50 index, 33% companies jumped more than 5x, 67% companies jumped more than 3x and 90% more than doubled. The median returns for the entire 1,600 company universe was 3.9x. In such a broader market rally, risk taking may be mistaken for brilliance. Before giving oneself credit for finding a multi-bagger, think twice. Detailed performance tables are provided at the end of this memo in Annexures.
Surprising Difference between Valuations Indicated by P&L vs BS and CF Ratios
Market valuations are near historical highs based on widely followed ratios such as P/E, EV/EBIDTA and Market Cap/GDP. Market crashes (25%+ drawdowns) after peaks are nerve racking and investors dread going through them. Stock market cycles typically peak when there are excesses in the market and in the economy. Market crashes rarely happen just because valuation multiples are at extreme. Typically there are excesses at the economy and corporate level too.
I have presented data in my previous couple of memos on how the balance sheet of corporate India has been improving and how the leverage has dropped to the lowest level in its history. Now let me present a different perspective on valuation using the balance sheet and cash flow ratios. I had a gut feel about this based on anecdotal evidence, but the actual results still surprised me. Do spend some time comparing current levels with those at historical market peaks.
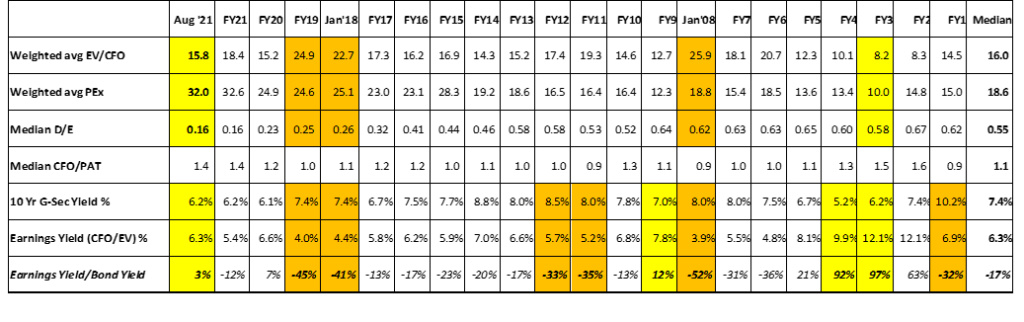
Source: Ace Equity and Bloomberg. For calculating the above ratios, the universe is non-financial companies (BSE 500 + companies in all mid and small cap indices) for whom Ace Equity has detailed balance sheet and cash flow data available for FY21. CFO – cash flow from operations; PAT – profits after tax
Against the common perception that markets and the economy are currently disconnected and are at all time high valuations, please note the following:
→ Absolute growth in CFO from FY19 to Aug’21 has been 250% vs Nifty/Nifty small 100/Nifty mid 100/BSE 500 returns of around 150%. With CFO having increased much higher than the indices, EV/CFO has actually dropped by 37% since Mar’19.
→ At previous market peaks, cash earnings yields were at significant discount to the bond yields (e.g. discount of 51.5% in Jan’08, 35% in FY’11 and 45.4% in FY19). Today it’s at a premium of 3%
→ The current cash earnings yield (CFO/EV) of 6.3% is above the bond (10 year G-Sec) yield of 6.2%
→ While at present (Aug’21) the P/E multiple is near all-time high, the EV/CFO multiple is at 15.8 just below the 20 year average and well below the high of 25.9 reached in Jan’08
→ Cash earnings yields have rarely been above bond yields viz. at present, post COVID crash (Mar’20), GFC crash in FY09 and during the FY02-FY05 period. Historically, equity returns have been very strong in the subsequent years post such occurrences
→ Today the D/E ratio is at its historic low and the CFO/PAT ratio is near historic highs. Shows extremely strong balance sheet and no signs of excesses that are typical of economic peaks
→ CFO/PAT has dropped (to <= 1) in each of the previous peaks. Today it’s at 1.4 which is near historical highs of 1.6 reached in FY02
One more common fear that investors have is about the US Federal Reserve tapering and/or increasing the Fed rate. We have compiled historical data to study how US equities have performed during the Fed rate changes.
Federal Reserve Rate Change vs S&P 500 Returns

Source: Bloomberg
Except for the last 17 months, Fed rate and equity markets have moved in the same direction. It seems rational as Fed generally raises rates when economy is improving and inflation is picking up. Moderate inflation and a strong economy is supportive of corporate profitability and hence equity markets. Also rising rates are negative for bond prices and it’s possible that investors would rather have increased allocation to equities at the expense of bonds during such times. I believe, the real fear of market crash should be when the rate cycle peaks and the down trend starts. Currently we seem to be a few years away from it. Even though this data is for the US, most markets are highly correlated to them and crashes tend to be synchronized.
Both the above data sets support a strong case for equities, but I would caution that it’s not necessary for the historical relationship to hold true across all times.
Where do we see Opportunities?
We continue to remain positive on building materials, real estate and export (or import substitution) themes. I have spoken in detail about these themes in the past and hence not repeating it.
Indian MSMEs and unorganized companies who provide mass employment have suffered from COVID and this has negatively affected the income levels of the massive low income population. At the same time, the top end (<5% of total) of the population has come out economically stronger from the crisis. This has been driven by multiple formal sectors doing really well such as IT, financial services and export oriented (chemical, pharma, textiles, metals, etc.). This is reflected in the salary increases for corporate India. If one analyzes the data of BSE 500 companies, the annualized employee cost for the Jun’21 quarter has increased (YoY) by more than INR 131,000 cr. To put this in perspective, for the entire listed real estate sector, the total sales for the last one year were less than INR 57,000 cr. These top of the pyramid consumers (<5%) make the biggest difference to incremental consumption and growth in the economy. The remainder 95% of our population mostly consume the basic necessity products/services and such demand is fairly stable.
Other aspect to consider is the wealth effect from investment returns. Just in the last one year (not even from Mar’20 lows) the total market capitalization of listed Indian companies have increased by more than INR 100 lac cr (45% of GDP). Meaning, investors (and many of them new) have become richer by this amount over the last one year. The domestic public investors (including DIIs) make up roughly 30% of this and the promoters make up 50%. The rest are FIIs. During this upcycle, wealth creation is relatively broad based and this should aid discretionary consumption. At the same time, rural India is doing well with agriculture commodity (such as sugar and cotton) boom. The government finances are also relatively strong compared to any other crisis times with surprisingly high tax collections. Government has announced $1.4 trillion spend on infrastructure over the next 5 years which is higher than the much publicized $ 1 trillion US infra spend.
All the four wheels (domestic consumers, private corporates, government and exports) of our economy seem to be in good shape all at the same time and augurs well for corporate profitability growth. With strong fiscal position, corporate balance sheet, export market share gain potential in many sectors and strong consumer, stars seem to have aligned for this to be India’s decade. Serious wealth could be created in many sectors. Hope we as a country don’t miss this opportunity. All the very best.
Warm Regards,
Samit S. Vartak, CFA
Founder and Chief Investment Officer (CIO)
Email: ir@SageOneInvestments.com
Website: www.SageOneInvestments.com

*SageOne Investment Managers LLP is registered as a PMS and an AIF with SEBI.
Appendix
SageOne Core Portfolio (SCP) Performance (Net of Fees)
For the first three years, we managed proprietary funds and for the last 9 years and 1 month, we have been advising/managing funds for external clients. Since clients have joined at various stages, individual performance may differ slightly based on the timing of purchases. For uniformity and ease, we measured our IA performance using a “representative” portfolio (that resembles advice given to clients) and we call it SageOne Core Portfolio (SCP). SageOne core portfolio is not a dummy/theoretical portfolio but the CIO’s actual total equity portfolio. The representative portfolio until FY17 was reviewed by KPMG. Post that the performance is for the PMS scheme. Calculated on a TWRR basis for the entire period.
12 Years 5 Month Performance in INR (Apr 2009 – Apr 2021)
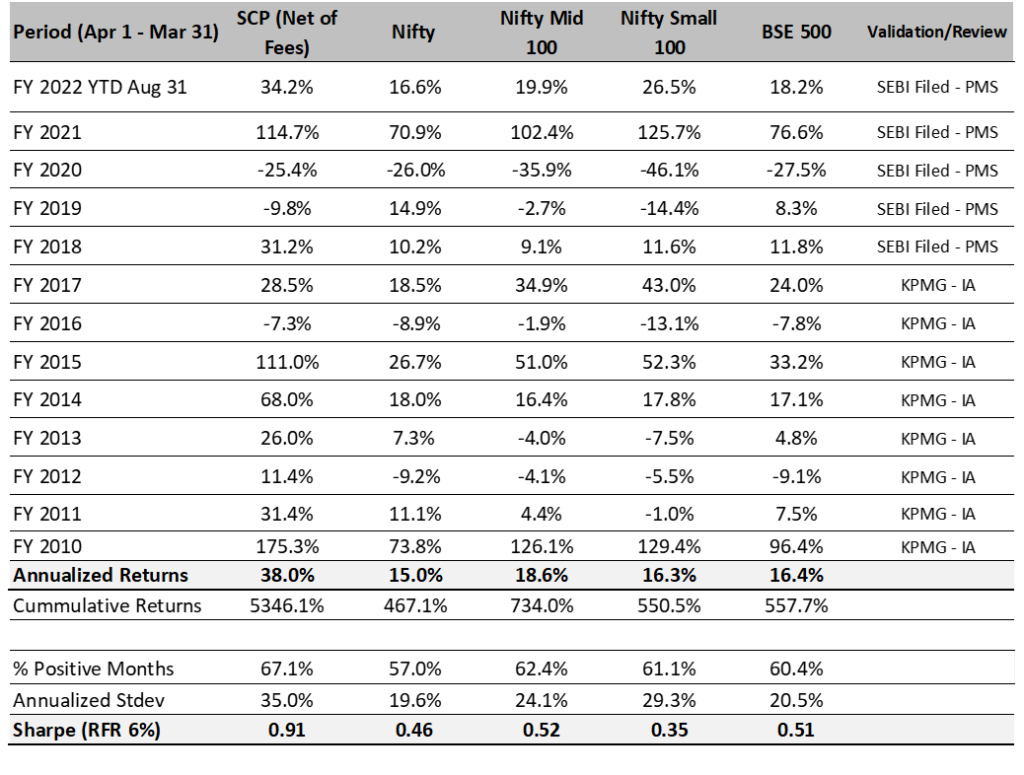
Source: SageOne Investment Managers, Bloomberg, Wealth Spectrum
* SCP consists of 15 stocks as of Aug 30, 2021. Average Mcap 25,100 cr
SSP Portfolio* Performance (Net of Fees)
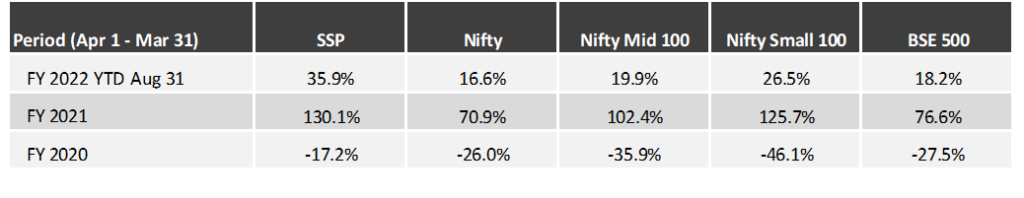
Source: SageOne Investment Managers, Bloomberg, Wealth Spectrum
* SSP (SageOne Small&MicroCap Portfolio) portfolio is composed of 12-20 stocks with Mcap ranging from 500 cr to 5000 cr at entry. This scheme was launched last year. Average Map as of Aug 31, 2021 was 6,700 cr
SCP: Latest 9 Years 5 Month Performance (Apr 2012 – Aug 2021)

SCP: First 3 Years Performance (Apr 2009 – Mar 2012)
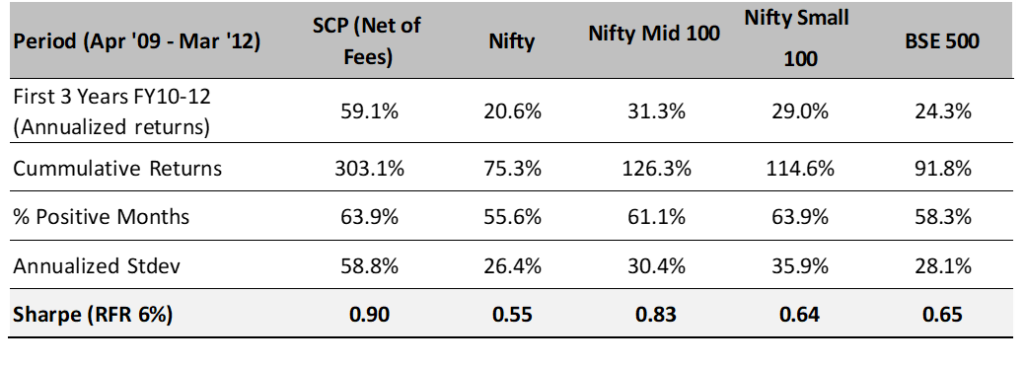
*We have consciously changed the composition of the core portfolio in terms of the average size of companies and the number of stocks in the portfolio after we started advising external clients in April 2012.
*The weighted average size of stocks at the start in FY10 was below $0.25 bn which has increased to more than $3.0 bn by the end of Aug ’21. Also, the number of stocks has increased from 5 (+/- 2) in 2009 to 14 (+/- 2) during the past 9 years and 5 month.
*Reasonable diversification was done by design to improve liquidity and reduce volatility as a result of which annualized standard deviation has come down from 59% for the first 3 years to 22% during the last 9 years and 5 month.
Legal Information and Disclosures
Any performance related information provided above is not verified by SEBI.
This note expresses the views of the author as of the date indicated and such views are subject to changes without notice. SageOne has no duty or obligation to update the information contained herein. Further, SageOne makes no representation, and it should not be assumed, that past performance is an indication of future results.
This note is for educational purposes only and should not be used for any other purpose. The information contained herein does not constitute and should not be construed as an offering of advisory services or financial products. Certain information contained herein concerning economic/corporate trends and performance is based on or derived from independent third-party sources. SageOne believes that the sources from which such information has been obtained are reliable; however, it cannot guarantee the accuracy of such information or the assumptions on which such information is based.