
This memo marks the completion of two years since the SageOne Large and Midcap Fund (SLMP) began managing client funds. In our previous three memos, we emphasized the importance of our investment process, viewing performance as a direct outcome. Having navigated two challenging market periods in our investment journey so far, we are pleased with both our process and the resulting performance.
Over the years, SageOne has built a strong reputation as a fund house known for identifying high-quality businesses and delivering superior returns, particularly in mid-cap and small-cap universe. While SLMP is focused on large-cap universe, given its long-term investment return objectives, we continue to mirror SageOne’s investment philosophy in SLMP — investing in high- quality and superior earnings growth businesses with an objective to deliver superior long-term returns compared to the benchmark.
As fund managers, we have a collective experience of over 3 decades in analyzing businesses from large caps and larger mid-cap universe. We strongly believe that identifying superior investment opportunities and generating alpha is an art — one that transcends market capitalizations when approached with discipline and a well-defined investment process.
This memo summarises the main drivers of our portfolio’s recent strong performance, highlighting the role of active stock selection in current Indian market conditions. We discuss SLMP’s relative valuations and explain how our investment process is structured to maintain returns regardless of AuM size. The memo also covers FAQs such as the effects of Trump-era tariffs, the balance between large-cap and mid-cap holdings, portfolio churns, and recent strategy changes, and concludes with our future outlook.
SLMP performance
We are pleased to report that the portfolio has consistently outperformed across all time periods. Over the past three and a half years, the portfolio has delivered ~20% CAGR returns post fees, by investing in the Top 200 companies (as defined by AMFI).
Net Returns of SLMP vs Benchmarks (as of August 31st, 2025) *
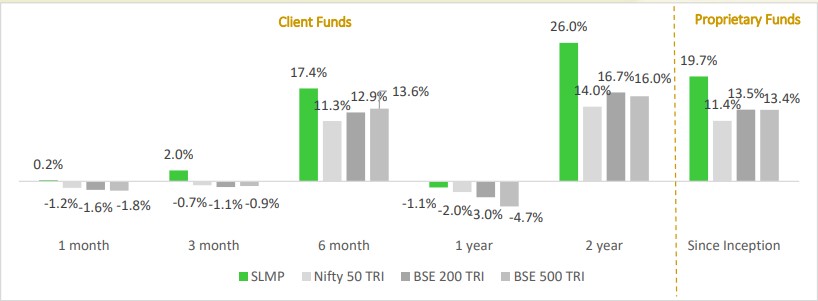
*Returns are net of costs and fees and a combination of managing proprietary funds from 1st April 2022 up to 24th August 2023, followed by managing client money. Returns greater than 12 months are annualized returns. BSE 200 TRI is assumed as BSE 200 returns plus dividend yield of 2.4% p.a.
SLMP performance across time periods
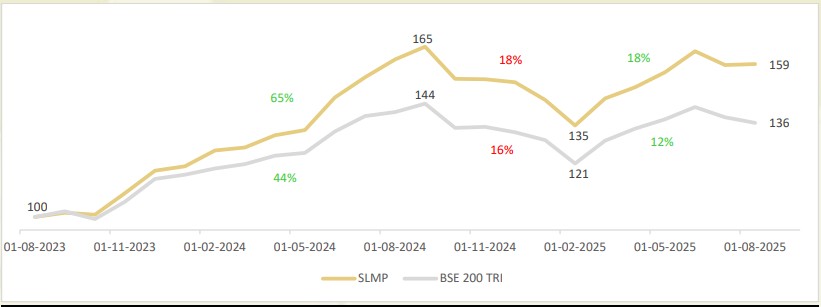
Breaking down the performance by time period, we significantly outperformed (by approximately 20%) during the market upswing until September 2024 – 65% returns for SLMP vs 44% for BSE 200 TRI. More importantly, during the downturn over the past year, our drawdown was similar to that of the indices at ~18%, and our subsequent recovery has been much faster. Absolute 2 year returns of SLMP stands at 59% vs 36% for BSE 200 TRI, backed by superior return profile of underlying portfolio stocks in SLMP. Overall, we are very satisfied with both the process and the results, while always believing there is room for continuous improvement.
SLMP Net Asset Value (NAV) for the 2-year period of managing client money
Is the current level of outperformance sustainable?
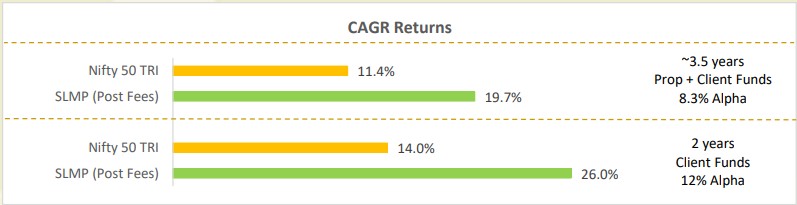
Our stated aspiration since the inception of the fund has been to generate an alpha of 3–5% over the Nifty 50 TRI, net of all fees and costs. This target is significantly higher than the typical long-term average 1–2% alpha delivered by most large-cap mutual funds relative to the same benchmark. When compounded over a multi-year horizon, this differential in alpha can lead to a substantially higher cumulative return for SLMP compared to similar offerings—provided we are able to consistently meet our stated aspiration.
Over the past 2 years of managing client money, we have delivered an alpha of 12% over the Nifty 50 TRI—significantly exceeding our stated aspiration of 3–5% alpha. If we include the earlier period of managing proprietary capital, the alpha over the past ~3.5 years is 8.3%, again well above our long-term aspiration.
While we remain fully committed to maximizing risk-adjusted returns, we recognize that sustaining such elevated levels of outperformance may be challenging. That said, we remain confident in our ability to achieve our original aspiration of generating 3–5% alpha over the Nifty 50 TRI over the next 4–5 years.
Performance breakdown
A comprehensive contribution analysis of our portfolio’s performance over the past two years demonstrates that from the 60% absolute returns – positive contribution was 64% while negative contribution was just 4%.
Regarding the negative contributions, none of the stocks experienced a drawdown exceeding 10%, and no single stock had a negative contribution greater than 1%. Of the six stocks with negative contributions, three are still part of the portfolio. We anticipate these three existing stocks to do well due to an improvement in earnings and due to reasonable valuations. The three exited stocks had a combined negative contribution of only 1.5%. Moving forward too, we should remain agile in exiting positions or finding better opportunities.
On the positive side, several stocks performed well, and we are pleased that our performance is diversified across multiple stocks and sectors, rather than being driven by just one or two outperformers. Contribution is defined by allocation multiplied by returns, highlighting the importance of assigning high weights to high-conviction ideas. Stocks with significant allocations, such as Trent, Indigo, Bharti, and Canara, have delivered strong returns, thereby boosting our overall performance.
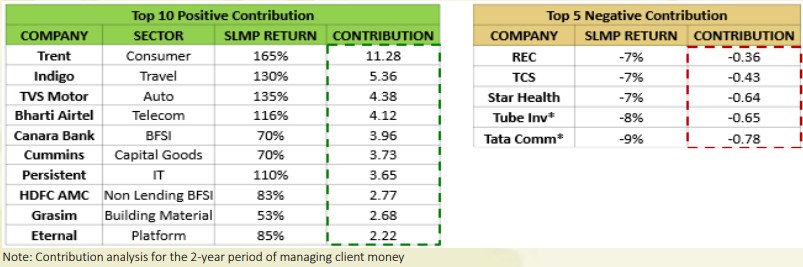
Our performance has been significantly boosted by our strategic underweighting in underperforming sectors and ability to identify outperformers in various sectors. We maintained minimal exposure to sectors like FMCG, IT, building materials, and chemicals, which have underperformed. Conversely, we were overweight in sectors like discretionary consumption, non-lending BFSI, auto, and telecom, all of which have delivered strong returns. A key factor in identifying outperformers has been our strong circle of competency, particularly in sectors like consumer, auto, and BFSI. For instance, in the consumer sector, all three top-performing stocks over the past two years are included in our portfolio.
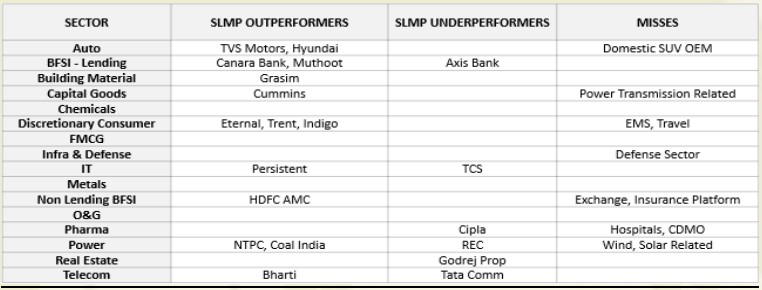
Note: 2-year period of managing client money. SLMP Outperformers are stocks which have delivered >2x of respective median sector return. SLMP underperformers have delivered lower returns than their respective sector returns.
We continuously analyze our mistakes and misses. Mistakes are typically underperforming stocks relative to their sector returns, which we monitor closely. We also remain cognizant of missed opportunities in sectors such as defense and power. While our circle of competency is currently lower in some of these areas, we are committed to improving our understanding over time. In hindsight, we acknowledge being somewhat late to sectors like EMS, hospitals, and CDMO; however, recognizing their long-term potential, we subsequently included them in our portfolio.
Key reason for portfolio outperformance
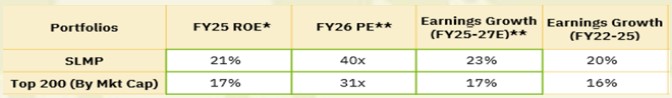
We believe it’s important to discuss the process that has led to the performance. At SageOne, we have always prioritized earnings growth, as we feel it provides a significant margin of safety. Similarly, within our SLMP strategy, we focus on companies with high earnings growth, targeting a range of ~16% to 18% CAGR.
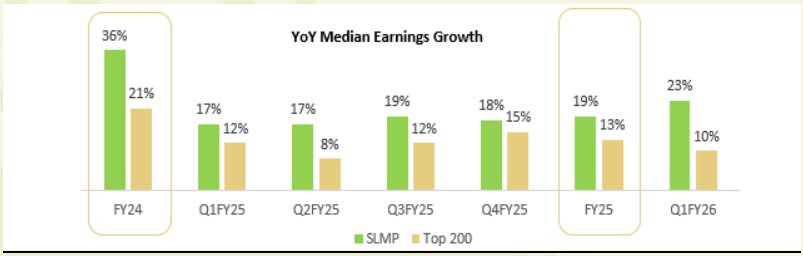
We are pleased that SLMP has consistently delivered growth every quarter, even in a subdued, low-growth environment. While the growth of the Top 200 companies has remained volatile, SLMP’s earnings growth has been strong and resilient each quarter.
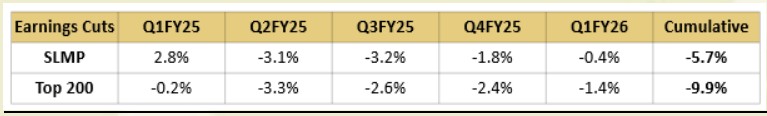
Furthermore, SLMP has experienced fewer earnings cuts. Over the last five quarters, the Top 200 companies have seen cumulative earnings cuts of 10%, whereas the SLMP portfolio-level earnings have only seen a 6% cut. Only 15% of companies in our SLMP portfolio have experienced earnings cuts exceeding 10%, compared to almost 40% for the broader Top 200 companies.
Our aim is not merely to build a portfolio with high expected growth that suffers significant cuts during a downturn. Instead, we prefer a balanced approach. We closely study and track operating metrics every quarter, which gives us confidence in less variability in future earnings.
The low-growth environment has created a challenging backdrop for the market
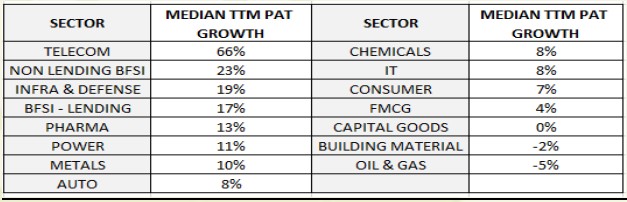
In the current growth-starved environment, navigating the market has become particularly challenging. The attached slide illustrates the median TTM (trailing 12 months) PAT growth for each sector within the top 200 companies’ universe. As the table shows, very few sectors are experiencing double-digit growth.
While Telecom growth appears high, this is largely due to deleveraging, which is not a permanent trend. Non-lending BFSI continues to be a sector demonstrating consistent growth. Defense has seen growth to date, but we are uncertain if this will be sustained on a high base. Infra spending, being government capex-linked, has been volatile as the government shifts focus towards boosting consumption. BFSI lending initially saw some recoveries and lower Non-Performing Assets (NPAs), but is now witnessing a spike in NPAs in certain areas, alongside slowing credit growth. While NBFCs are still showing growth, growth in most banks has tapered.
Apart from these 4 sectors, all others sectors such as IT, FMCG, Pharma (generics), Auto, Capital Goods, and Building Materials are experiencing single-digit growth. This narrows the investable universe. Therefore, in such a slow-growth environment, we believe that a bottoms-up stock-picking approach is crucial to identify companies growing faster than their respective sectors.
Elevated valuations have added to the challenges of investing in the current environment
SLMP’s portfolio P/E has been gradually rising, reflecting the broader trend of increasing valuations across sectors. Despite muted earnings growth, valuations remain elevated—likely driven by sustained domestic flows into mutual funds and long-term optimism about India’s structural growth and macroeconomic stability.
The rise in SLMP’s portfolio P/E is largely attributable to our selective exposure to high-growth businesses, whose valuations have expanded. In such an environment, we consciously prefer to take valuation risk over business risk. We believe that earnings growth provides a strong margin of safety. Even if we slightly overpay today, the potential downside may only be in the short term. For instance, if a stock is 20% overvalued but grows earnings at 20%, the stock might deliver flat returns over the first year (as the multiple normalizes), but thereafter could compound in line with its earnings. On the other hand, a stock trading at a low multiple—say, 10x P/E—with weak earnings visibility, could de-rate further to 8x, leading to a 20% loss and continued uncertainty in future performance.
This is why SLMP’s portfolio is tilted toward companies with higher earnings visibility, stronger ROEs, and slightly premium valuations. We believe this approach offers a more reliable path to long-term wealth creation, even if it means enduring short-term underperformance during valuation corrections.
Source: Ace Equity, SOIM. All ratios are median numbers
*Based on Bloomberg Consensus Estimates **Based on our estimates
While growth has slowed, valuations for most sectors remain high. However, the BFSI, Metals, and Oil & Gas sectors, which historically trade at low multiples, continue to do so. These three sectors account for over 50 stocks out of the top 200 names, representing more than 25%. This significantly influences the lower overall P/E ratio of the Top 200 due to the substantial presence of these stocks.
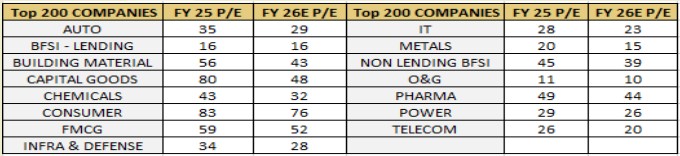
Note: Based on Bloomberg Consensus Estimates. All ratios are median numbers
In our SLMP portfolio, we have limited exposure to BFSI lending (14% of the portfolio) and no exposure to the Metals or Oil & Gas sectors. When we exclude these three sectors from both the SLMP and the Top 200 baskets, the P/E ratios become quite similar, despite SLMP’s superior growth and Return on Equity (ROE).
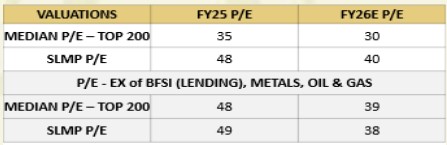
Note: Based on Bloomberg Consensus Estimates.
Therefore, while we acknowledge that SLMP’s P/E has recently increased due to portfolio churn, we believe it remains in line with the P/E of our investment universe.
How is the relative performance of SLMP and could higher AuM be a detriment to the outperformance?
Over the past two years, SLMP has delivered strong performance in managing client capital. With a 26% compound annual growth rate (CAGR), SLMP has significantly outperformed the average 18% CAGR delivered by mutual funds in the large- and mid-cap category. When compared to a peer group of 30 mutual funds, SLMP stands out by surpassing most in terms of returns. However, we do not attribute this outperformance to our relatively smaller fund size. We have always managed SLMP with the discipline and rigor typically associated with funds significantly larger than our current size. While it is common for larger funds to experience diminished returns, we have proactively mitigated this risk by avoiding illiquid investments (stocks with average daily turnover (ADTO) of less than INR 50 Cr). Our current AUM would have permitted us to purchase and exit this company but whilst it would boost short term performance, it would not be unsustainable over a longer term.
The ADTO of the stocks within our portfolio is approximately INR 300 crores (last 6 months’ time period). This robust liquidity ensures that even with an Assets Under Management (AUM) of INR 7,500 crores, acquiring a 4% stake in any company would align with the daily transacted value of that stock. Therefore, we are confident in stating that even if SLMP were 10–20 times its current size, our performance would have remained largely unchanged. Our investment universe and strategy are scalable, and the types of opportunities we pursue are available in sufficient depth and liquidity to accommodate significantly larger capital without compromising returns.
What has been the 2-year SLMP churn and recent portfolio changes?
Average churn over the past two years has been maintained within the expected range of ~20–25%, with a higher turnover in the second year compared to the first. Our Top 10 holdings have been largely stable too.
In the most recent year, we exited several low-growth companies such as NTPC, Coal India, TCS, JSW Steel, and REC, as they no longer met our growth criteria. We added companies like Dixon, Polycab, Divi’s Labs, and Max Healthcare, which better align with our focus on high earnings growth and strong return metrics.
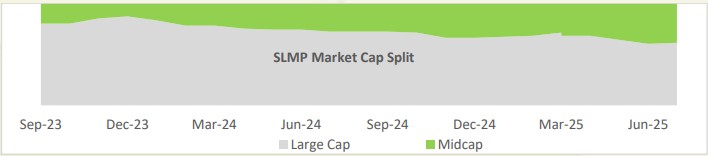
Does the shift in market cap allocation within the portfolio indicate a change in strategy or market outlook?
The share of large caps (Top 100 companies by market cap, as defined by AMFI) in the SLMP portfolio has declined from ~80% two years ago to around 60% today. This shift is not a result of any intentional move away from large caps, but rather an outcome of our bottom-up stock selection process, where we identify high-quality businesses from the Top 200 companies by market cap. We do not view stocks outside the Top 100 as inherently riskier or more rewarding. Our allocation decisions are driven by business quality, earnings growth potential, and valuations—not by market cap classifications. Today’s well-run midcaps can be tomorrow’s large caps through consistent performance and compounding.
It’s also important to note that the current market cap cut-off for the 101st stock stands at INR 93,000 Cr. If this threshold were marginally reduced to INR 87,000 Cr, five of our current portfolio companies would shift from midcap to large cap, increasing our large cap exposure to approximately 77%.
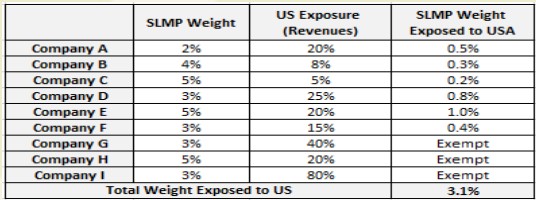
What is the impact of Trump tariffs on the SLMP portfolio?
Excluding companies in pharma generics and IT services—which are currently exempt from U.S. tariffs— only six SLMP portfolio companies have direct exposure to the U.S., collectively accounting for ~20% of portfolio weight. However, these companies export only 5–25% of their revenues to the U.S., resulting in just ~3% of SLMP’s overall portfolio revenues having any meaningful exposure to the U.S. market. While we do take U.S. tariff risks into account, they do not dictate our investment decisions. If a compelling opportunity arises—where the impact of tariffs is already factored into the valuation and risk-reward remains favorable—we would not hesitate to increase our exposure.
What is the current outlook?
The government has been proactive on the macroeconomic front, aiming to stimulate consumption through recent changes in personal income tax slabs and proposed revisions to GST rates. These adjustments—particularly in categories such as air conditioners, cement, and two- and four-wheelers—should help make essential and aspirational consumer goods more affordable, potentially driving growth in the medium term.
However, global uncertainty remains a headwind. In particular, the continuation of Trump-era tariffs has created an unpredictable environment for exporters, adding external pressure to an already complex macro landscape.
From a market standpoint, growth has certainly moderated, with only a few segments showing meaningful momentum. At the same time, valuations remain elevated across most sectors, especially in those few pockets where growth persists. This makes the current investment environment particularly challenging, with opportunities becoming increasingly selective.
Here, we prefer valuation risk over business risk. We are fine investing in companies with higher relative valuations if they demonstrate quality businesses and promising superior long-term earnings. Sustained earnings growth serves as a margin of safety against short-term valuation issues.
While near-term returns may remain muted given current conditions, we believe that a recovery in earnings could support continued market performance. This remains a bottom-up, stock picker’s market—unlike the broad-based rally of the past two years, today’s environment demands careful selection, as market breadth has narrowed significantly.
Looking ahead, we remain constructively bullish on India’s long-term story. We continue to aspire for16–18% annualized returns over a 4–5-year horizon (post fees) and believe this remains achievable. We are confident in the robustness of our investment process, encouraged by the outcomes it has delivered so far, and committed to learning continuously from both successes and missteps.
Thank you for always having faith in SageOne and we hope that we continue to deliver to our clients through this offering and look forward to your participation.
Warm Regards,
Satish Kothari & Kshitij Kaji
Fund Managers, SLMP
SageOne Investment Managers LLP