
Dear Investor,
While major Indian indices hit all-time highs, the divergence continues to widen between these indices and the real economy as well as the broader markets. This is mainly on account of indices being driven by small set of large consumer focused expensive stocks. Overall economic growth has slowed drastically and until this revives, earnings growth in the broader market will continue to be illusive and investors will continue to flock into select few companies which offer slow but reliable growth. The last two years have been characterized by expensive stocks (across large and mid/small-caps) getting more expensive and the rest of the universe reaching attractive/cheap levels last seen in 2012-13. Even in our portfolio, the most expensive stocks have outperformed the cheaper stocks, with very little correlation with the earnings growth.
As you know, our strategy has been to invest in companies with potential to grow earnings above 20% over our investment horizon of 3+ years. While we are fine paying some premium valuation in select cases, we are not comfortable paying expensive valuation for them. Majority of the large companies find it extremely difficult to grow their earnings above 20% per year over a 3+ year horizon just because of their large base, and the extreme rare ones who are expected to grow have been trading at astronomical valuations in the last few years. Hence we haven’t been able to include large companies in our portfolio in the recent couple of years.
Even though we have been able to outperform the mid and small cap indices, it’s been almost an impossible task to beat the major indices in the last two years in absence of large and/or expensive companies in the portfolio. This definitely makes us question the validity of our strategy and the relevance of valuation in selecting stocks. Seeing losses in our clients’ portfolios is extremely painful and this triggers deeper introspection of our strategy. I have always been data driven and seek empirical evidence rather than getting influenced by anecdotal evidences to validate/discard any thesis.
In this memo, I would like to present two key analyses that we conducted as part of the introspection. First is the evaluation of the fundamental performance of our portfolios over the last 7 reported quarters since this underperformance started (Dec’17) and second is the analysis of the stocks which have been the best performing companies (fundamentally) over the last 8 years. I have selected this period specifically because this is when the high quality consumer oriented companies started their outperformance on the back of massive rerating of valuations.
First Analysis: Evaluating Fundamental and Price Performance
We follow only one investment strategy, but do offer two main variants of it. The oldest (since the beginning) is SageOne Core Portfolio (SCP), which is a concentrated portfolio of around 15 stocks on an average with allocations ranging from 4% to 10% at cost. The second one is the SageOne Diversified Portfolio (SDP), which is nothing but an equal weighted portfolio of SCP + 6 to 7 additional stocks. Both these portfolios invest mostly in companies with market capitalization (Mcap) of above INR 3,000 cr. We recently launched one more offering with the same strategy but focusing on small and micro-cap companies with Mcap ranging from INR 500 to 5,000 cr. Since this is very new, I am excluding it from this analysis.
As of December 31, 2017 we had 15 companies in SCP and 21 in SDP. Since then we have exited 4 companies. The following analysis focuses on the fundamental performance of the 17 companies we have held through this period of underperformance in SCP/SDP.
Total and Annualized Earnings Growth of Our Portfolio Companies
(Period of 7 Quarters from Dec’17 to Sep’19)
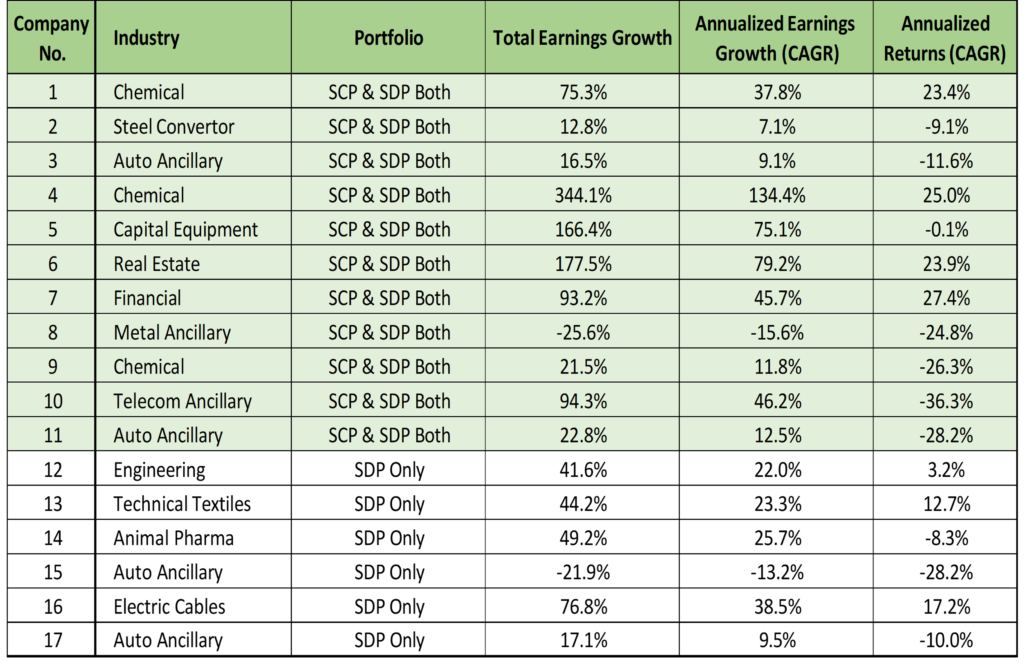
Source: SageOne Investment Advisors, Ace Equity
Average Statistics for Our Portfolios (Since Peak of Dec’17)
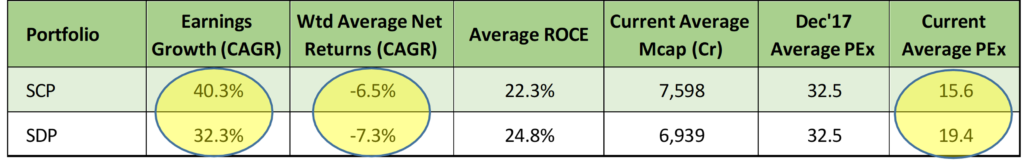
Source: SageOne Investment Advisors, Ace Equity
Note:
→ The above averages are simple averages to make it consistent with the subsequent analysis for the Nifty 50 index. Weighted averages would produce slightly different results.
→ The numbers would slightly defer if we incorporate the exits/inclusions during this period, but not statistically significant enough to alter the conclusion.
Both these portfolios are down 12-14% on an absolute basis and 6-7% on an annualized basis. Mathematically the average total earnings growth across all companies was around 80%, but the valuations have contracted by around 50%. Thus the earnings growth didn’t compensate for the valuation drop resulting in the downward performance of the portfolio. Obvious question is, whether a 30x PE multiple was justified during the Dec’17 period. I agree that it was on a higher side, but considering 30%+ expected growth in portfolio earnings we didn’t find it expensive enough to sell out. Even at the peak of Dec’17 the valuation for the portfolio was < 20x looking one year forward. Also the valuations during the late 2014 to early 2018 remained elevated at such levels and these were years with superior returns. Our investment calls are long term in nature and timing looks easy only in hindsight. Timing also haven’t worked for the select few stocks who have continued to become more expensive.
Now compare our portfolio performance with Nifty 50 index which was up 13% during this period.
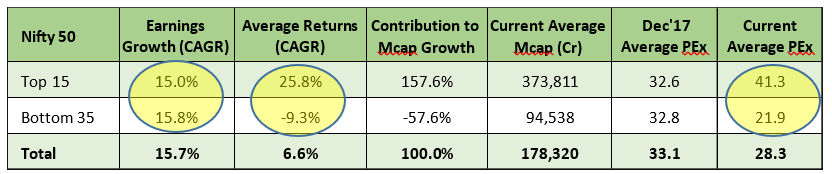
Source: SageOne Investment Advisors, Ace Equity
Note: Above companies ranked by increase in their Mcap from Dec’17 to Nov’19
For Nifty, the performance was skewed by the largest of companies. As can be seen, the top 15 companies continued to get expensive without superior growth. They contributed 157.6% of the increase in Mcap and the bottom 35 companies had a negative contribution resulting in those stocks being down by 17% (-9.3% CAGR) on an average since Dec’17. Earnings growth of these companies weren’t that divergent, but PEx rerating/de-rating has been the key reason for the variance in returns. When I compare even the top 15 Nifty companies with our portfolio, the fundamental performance of our portfolio companies was significantly better, but we still underperformed due to derating of the portfolio companies.
Second Analysis: Evaluating Traits of Best Performers
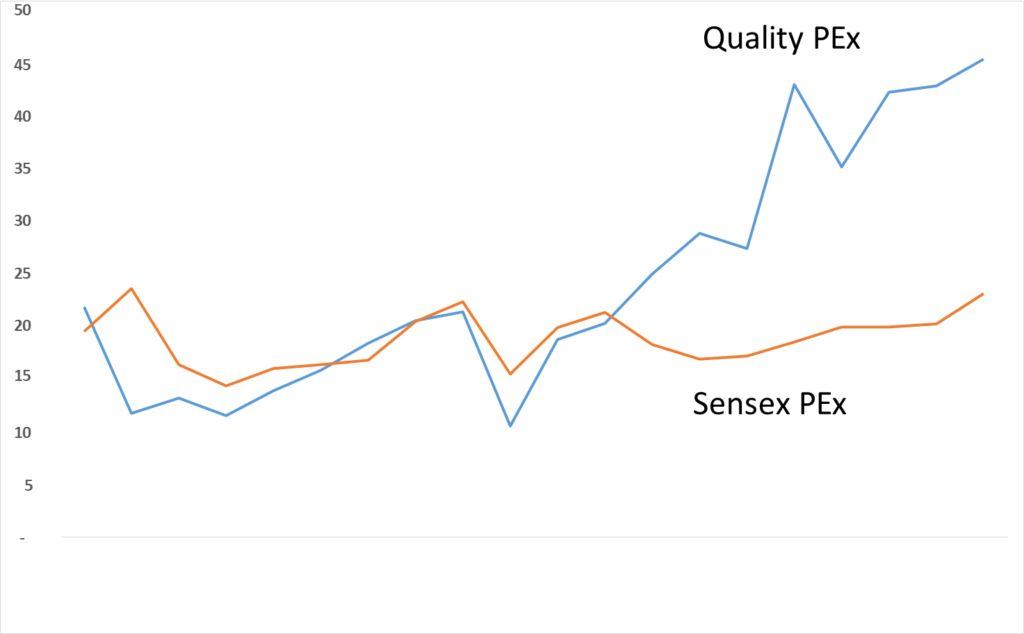
In our Jan’19 memo, I had presented analysis of the divergence in valuation multiples of select few large consumer oriented companies with the rest of the market. This period started post FY2011 and coincided with declining credit growth and significant slowdown in the earnings growth of corporate India. During the 2000-2008 period, Sensex as well as quality companies delivered 15% earnings growth, but during the subsequent 10 years the growth faltered for Sensex companies to 5% while the quality companies (for details please refer to the Jan’19 memo on our website) continued delivering double digit growth of 11%. This 6% growth Alpha attracted a lot of capital thereby rerating (doubling) the multiples as shown in the chart.
When I started my investing journey, the dream was to keep generating 10x in 10 years kind of returns. This translates into a 26% CAGR. This may be a difficult target to achieve for investors managing large capital, but as a small full-time investor, it’s worth keeping this dream. Question is how easy it is and how big the universe is which will deliver such returns.
I screened through companies that delivered returns of at least 26% CAGR during the tough 8 year phase since FY2011. The universe only included the largest 800 companies (as of FY2011 end) to ensure decent liquidity in the stocks. I was surprised to find that there were 68 companies that delivered returns above 26%. During bull phases, such shortlist would be much larger. Following are few key points I noted:
→ Only 2 companies (Kotak Mahindra Bank and IndusInd Bank) were from the top 100 (large-caps then). Translating in 2% hit rate.
→ There were 15 companies from the next 150 (mid-caps). Roughly 10% hit rate
→ Remaining 51 companies were from the next 550 companies (larger small-caps). Roughly 9.3% hit rate
→ Success rate in finding one of such winner was 5x in mid and small-cap stocks compared to the large-cap
→ There were only 12 companies which you can call consumer brands who could charge significant premium for their products. Their average PEx in FY11 was 18x which has shot up to 66x today. Largest amongst these 12 was Pidilite with Mcap of INR 7,500 cr. All others in the list (Page Ind, Bata, Havells, etc.) were much smaller with average Mcap of INR 2,000 cr.
→ Almost 85% of the shortlist included companies which sell products/services that are commoditized. Industries include chemicals, finance, building material and auto ancillary. This is against common perception that only super quality branded companies can deliver superior returns.
→ Prominent industries in the list such as finance, chemicals, building material, auto ancillary had high reinvestment rate. As Warren Buffet has noted numerous times, I can’t stress enough the importance of this. Compared to really high ROE with very little room for reinvestment, a reasonable ROE (20-30%) with very high and prolonged reinvestment opportunity creates tremendous wealth.
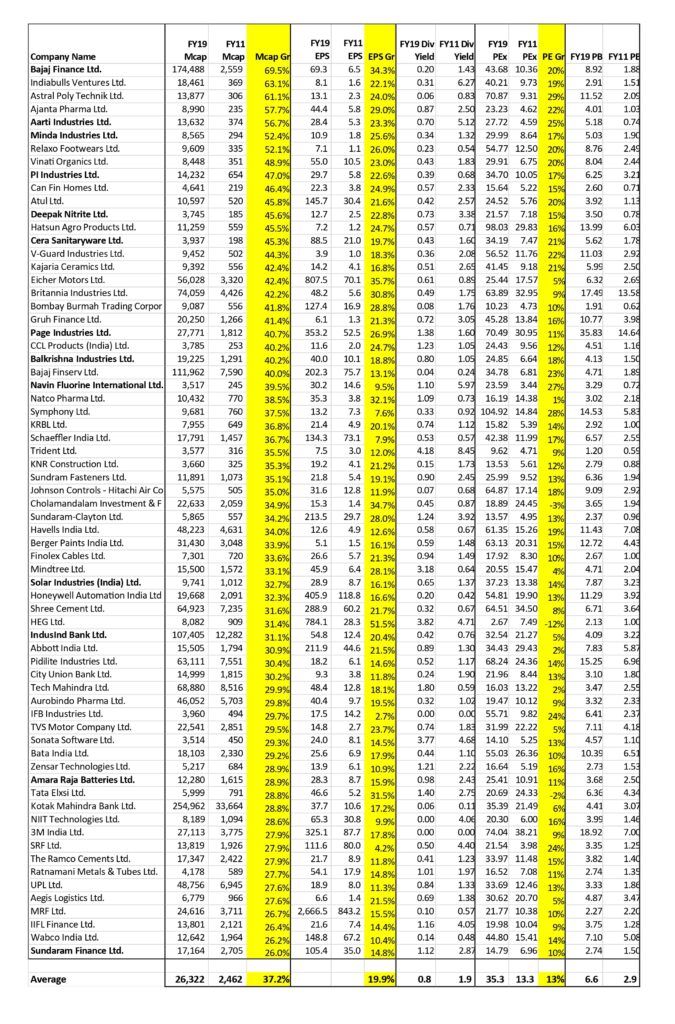
Below are the average statistics (FY 2011 to FY 2019) for the above mentioned group of 68 companies:
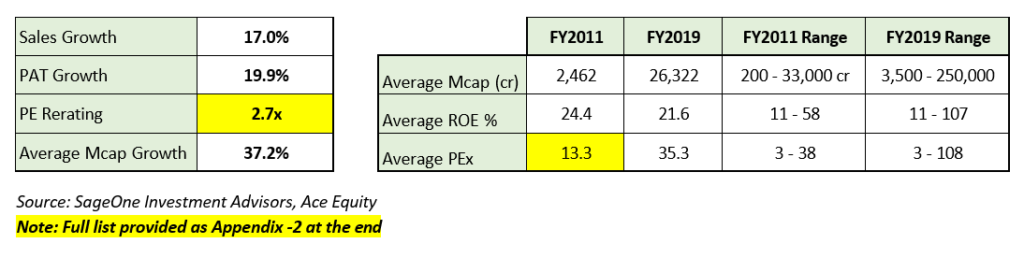
Key parameters to note:
→ The CAGR returns were 37% for the group meaning 23x in 10 years
→ PE multiple rerating was 2.7x, meaning 13% CAGR out of 37% was contributed by valuation increase
→ Average PAT growth of around 20% was enough to generate these returns. Believe me, finding 20% plus long term earnings grower is extremely difficult.
→ Average market cap (INR 2,462 cr) was at the border of the mid-cap and small-cap size.
→ Valuations were cheap (PEx of 13.3x) for the shortlist, which enabled the re-rating potential. Highest PEx was 35x across the 68 stocks. Today the average PEx is 35x.
→ Other valuation parameters such as dividend yield has dropped from 1.9% to 0.8%, and the PBx has jumped from 2.9 to 6.6 in this period.
→ ROE remained flat and actually has come down slightly, and still these companies have generated phenomenal returns due to growth created from high reinvestment
We at SageOne strive to find such companies with earnings growth of 20%+ and where we aren’t over paying so that there is room for the PE multiple to contribute to returns. Of course we may get some investment calls wrong, but even if we are successful in finding 10% (in the last 8 years we had 13 of the 68 companies in our portfolio for part/full period) of the shortlisted universe for our portfolio we would create significant wealth for our investors. We like “fishing in a pond where the fish is of high-returning variety”.
The above analyses helps reiterate our confidence in the strategy of investing in high growth companies at attractive valuations especially given that we have been fairly successful at finding companies that have grown earnings at significantly above the market.
Strategy Going Forward
When you experience few bull and bear cycles in the market, you realize that one’s investment strategy can’t work in all markets however robust it is. Every strategy is cyclical and this won’t ever change. When one is in an upcycle for any winning strategy, it seems to be the best and one will find numerous convincing reasons for it to continue to work forever. This confidence and supporting performance is how bubbles form and this will keep repeating in various strategies and asset classes. Key is to recognize this fact and stick to a strategy that you are good at and has worked for you rather than trying to predict the next best strategy.
Since my last memo, there have been significant fundamental changes in the Indian economy such as slashing of corporate tax rates, resolution of the Essar case, clarity in the IBC process, easing of liquidity for the NBFC/banking sector, government setting up a fund for last mile completion of real estate projects and break in downward sales trend for cars and two wheelers. Economy may be in a real slowdown, but you can’t deny that things are slowly but surely moving in the right direction. In absence of the banking clean up that this government started 5 years ago, our financial system was headed for a complete collapse. Systemically we are much stronger today and should reap the benefits soon. I am reasonably confident that the next 5 years for the credit growth and hence the India economy would be much better than the last 5 years. As is usually the case in life, improvements seem impossible when you are at the trough, but have no doubt that India will bounce.
Warm Regards,
Samit S. Vartak, CFA
Founder and Chief Investment Officer (CIO)
SageOne Investment Advisors LLP
Email: ir@SageOneInvestments.com
Website: www.SageOneInvestments.com

*SageOne Investment Advisors LLP is registered as an Investment Advisor, PMS and AIF with SEBI.
Appendix – 1
SageOne Core Portfolio (SCP) Performance (Net of Fees – used to be Gross)
For the first three years, we managed proprietary funds and for the last 7 years and 8 months, we have been advising/managing funds for external clients. Since clients have joined at various stages, individual performance may differ slightly based on the timing of purchases. For uniformity and ease, we measured our IA performance using a “representative” portfolio (that resembles advice given to clients) and we call it SageOne Core Portfolio (SCP). SageOne core portfolio is not a dummy/theoretical portfolio but the CIO’s actual total equity portfolio. The representative portfolio until FY17 was reviewed by KPMG. Post that the performance is for the PMS scheme. Calculated on a TWRR basis for the entire period.
10 Years 8 Month Performance in INR (Apr 2009 – Nov 2019)

Source: SageOne Investment Advisors, Bloomberg, Wealth Spectrum
* SCP consists of 14 stocks as of Nov 30, 2019. Investment Advisory and large PMS clients are advised this portfolio.
SDP Portfolio* Performance (Net of Fees)
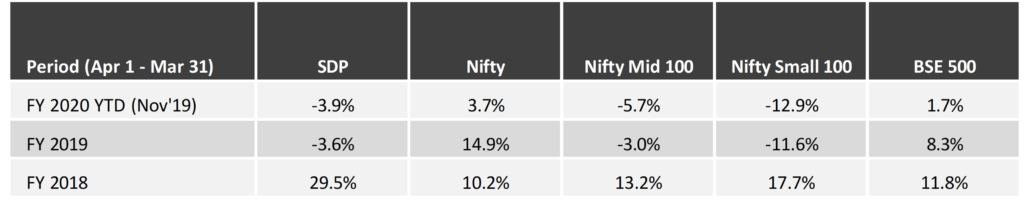
Source: SageOne Investment Advisors, Bloomberg, Wealth Spectrum
*SDP consists of 21 stocks as of Nov 30, 2019.
SSP Portfolio* Performance (Net of Fees)

Source: SageOne Investment Advisors, Bloomberg, Wealth Spectrum
*SSP (SageOne Small&MicroCap Portfolio) portfolio is composed of 12-20 equal weighted stocks with Mcap ranging from 500 cr to 5000 cr. This scheme was launched this year.
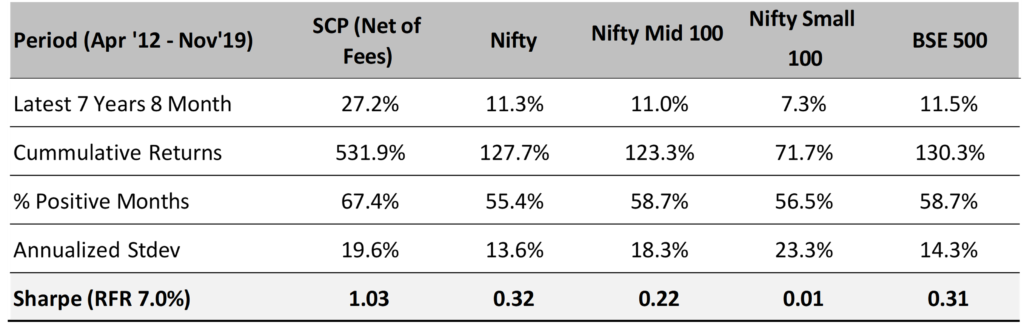
SCP: Latest 7 Years 8 months Performance (Apr 2012 – Oct 2019)
SCP: First 3 Years Performance (Apr 2009 – Mar 2012)
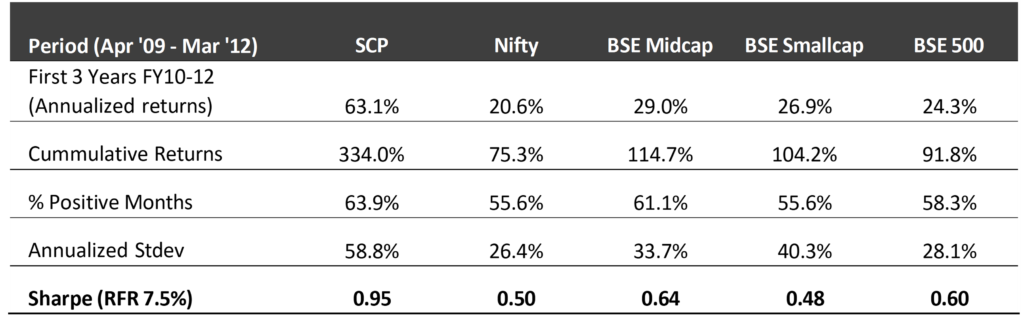
*We have consciously changed the composition of the core portfolio in terms of the average size of companies and the number of stocks in the portfolio after we started advising external clients in April 2012.
*The weighted average size of stocks at the start in FY10 was below $0.25 bn which has increased to nearly $1.2 bn by the end of Nov ’19. Also, the number of stocks has increased from 5 (+/- 2) in 2009 to 14 (+/- 2) during the past 7 years and 8 months.
*Reasonable diversification was done by design to improve liquidity and reduce volatility as a result of which annualized standard deviation has come down from 59% for the first 3 years to 19.6% during the last 7 years and 8 months.
Appendix – 2
Legal Information and Disclosures
This note expresses the views of the author as of the date indicated and such views are subject to changes without notice. SageOne has no duty or obligation to update the information contained herein. Further, SageOne makes no representation, and it should not be assumed, that past performance is an indication of future results.
This note is for educational purposes only and should not be used for any other purpose. The information contained herein does not constitute and should not be construed as an offering of advisory services or financial products. Certain information contained herein concerning economic/corporate trends and performance is based on or derived from independent third-party sources. SageOne believes that the sources from which such information has been obtained are reliable; however, it cannot guarantee the accuracy of such information or the assumptions on which such information is based.