
Dear Investor,
Throughout CY2023, the Indian equity market continued its upward trajectory, outperforming most global markets. Within India, the companies with low float and those benefiting from government spending significantly outperformed the major indices. Many pockets in the markets are moving extremely fast with very little time to act. High liquidity is propelling prices in these segments to unprecedented levels, triggering fear of missing out (FOMO) among investors. Doing thorough research is becoming expensive in the short term forcing many investors to react quickly with half-baked or no research. This tendency, typical of a bull market, frequently results in portfolios filled with lower-quality businesses. When the inevitable bear market materializes, catching many off guard, these shortcuts can turn out to be very expensive for long term returns.
In recent times, return on stocks have shown an inverse relationship with their float levels. Concurrently, valuation levels in the broader (non-large cap) markets have surged to heights seen only at previous market peaks. One will struggle to find anyone in the market opposing this view. It’s an overwhelmingly unanimous consensus and there are numerous warnings from AMFI, economists, fund managers and many other market participants. Does this mean it’s time to exit or make tactical changes?
Similar to while investing in a business, valuation multiples can’t be the only determinant of investing in the market. Factors such as fundamentals of the company, growth prospects, competitive positioning, management and where we are in an economic cycle are some of the other key considerations to evaluate while taking an informed decision. I will provide my views on this, in the Indian market context, in subsequent sections of this memo. Before that let’s look at where we stand in the historical context.
Last 10 yr History (median) of PEx, ROE (%) and PBx by Mcap in that Order
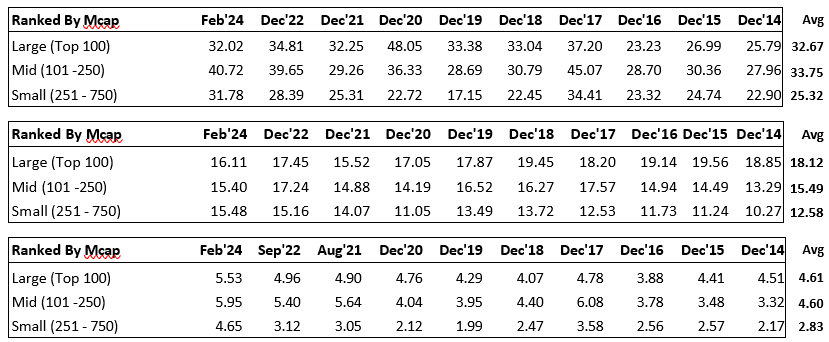
Data Source: Ace Equity (as of Feb 28th 2024)
The valuation multiples are around the same levels we saw during the 2017 market peak and there is no question that they are significantly above the 10 yr average for the non-large cap space. The gap between large cap and small cap universe has narrowed significantly, but at the same time the ROE has significantly improved for the small cap universe along with other metrics such as D/E and CFO/PAT ratio which I have presented in my previous memo in late 2021. One may argue that some improvement in valuations for the small cap universe is due to the improvement in balance sheet, working capital and cash flow post COVID.
During the previous two big peaks of the 2008 and 2017 bull runs, the performance of the smaller companies in the BSE 500 was significantly better than their larger counterparts. Below is the comparison of one-year performance before the peaks.
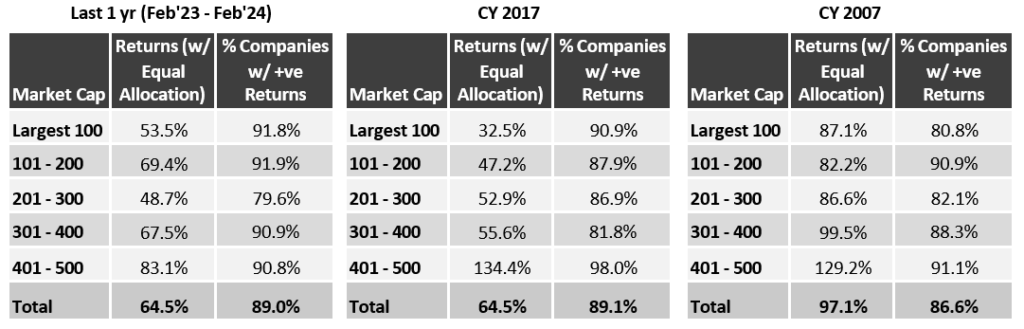
The data shows smaller companies doing better than the larger ones, but not to the same extent as 2017 or 2007 in terms of relative or absolute level. But again there is no denying that in recent times markets have delivered excessive returns beyond fundamentals that generally occur before the peak.
I have presented startling data in following sections of the memo that shows how some pockets have reached historical valuation and euphoric levels. Seeing the data presented, it may seem that it’s an easy call to exit or significantly reduce exposure to certain parts of the equity markets. I believe that it’s not that straight forward a call especially when looking at how corporate India is positioned.
There is no question that there will be corrections and some of them may be sharp, but no one knows (even if there is a massive consensus view) when they will occur and in that fear one may risk potentially missing out on one of the longest fundamentally supported bull market in India’s history.
Detailed performance tables are provided in the Appendix at the end of this memo.
Pockets with Extreme Excesses
The following table breaks the performance of low float (< 15% float) vs the rest for the largest 1000 companies (as of Feb 16th, 2024). It further breaks it down into performance of PSU (public sector units) vs non-PSU over the last 6 mo, 1 yr and 2 yr time horizon. The divergence in performance across these categories is remarkable and there is no denying a large impact of float on returns.
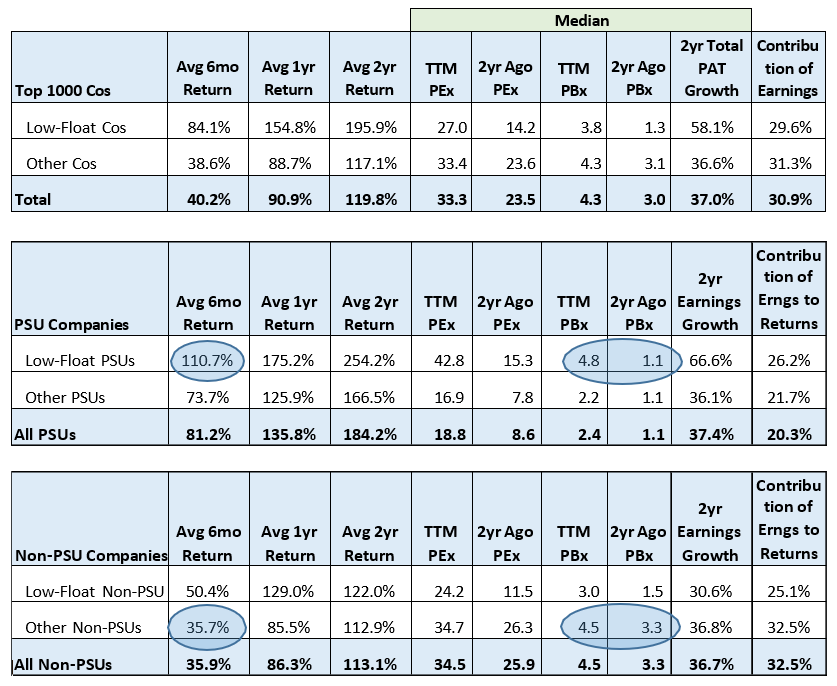
Data Source: Ace Equity (as of Feb 16th 2024)
In the last 6 months:
• The low float basket is up 84.1% vs 38.6% for the rest
• PSU basket is up 81.2% vs 35.9% for non-PSU basket
• Low float PSU basket is up 110.7% vs 50.4% for non-PSU basket
• Highest divergence is between low float PSUs at 110.7% and non-low float non-PSUs at 35.7%
• Non-low float PSUs have performed better that regular float non-PSUs
Even over the last 2 yr horizon, one can observe similar divergence:
• Low float PSUs are up 254.2% vs 112.9% for non-low float non-PSUs
• Absolute median earnings growth for the PSU basket over the last 2 years is 37.4% vs average returns of 184.2% for the basket. Similar gap is observed in most of the baskets
• Valuation multiples have jumped sharply for all companies
- PEx for low-float PSUs is up 2.8x vs 1.3x for non-low float non-PSUs
- PBx for low-float PSUs is up 4.4x vs 1.4x for non-low float non-PSUs
The above data includes all PSUs in the largest 1000 companies of listed India. If you look at 57 PSUs which are part of the PSU index now and were also listed during the FY02-08 bull market, the valuation multiples today have crossed the peak reached in Jan’08.
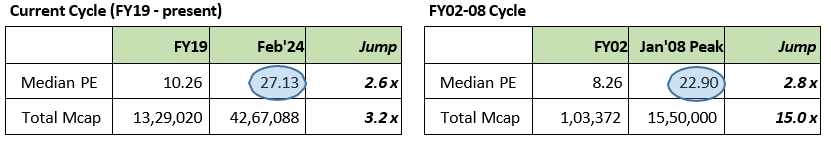
*Data for 57 companies in the PSU index which were listed in both cycles to have fair comparison
There are many pockets such as the above and more that are at euphoric levels. Many low float stock prices are showing signs of manipulation. One needs to remain extremely vigilant about such stocks and pockets. Once you identify areas to stay away from, there are many exciting bottoms up opportunities available at reasonable valuations.
Glass Half Full or Glass Half Empty
We remain in the glass half full camp. We believe that the overall valuation in the mid/small cap universe may be stretched by around 20% (compared to the average during the last 10 years of PM Modi regime), but valuation alone has never been the reason for crashes in the markets. Historically crashes have been triggered by stress or excesses in the economy such as banking crisis (2008 and 2018), fiscal stress (2012/13), natural disaster (2020) and careless investment cycle (2000 and 2008).
Currently we don’t see any such stress/excesses in the economy. On the contrary, we continue to see very low corporate debt/equity levels, high operating cash flow/net profit ratio, prudent capital expenditure (capex) and frugal working capital levels. Given that we are investors in the non-large cap space, I am not a big advocate of “all times are the best times” to invest in the markets. Small cap cycles (peak to peak) have lasted on an average around 3.5 years as I had presented in my last memo. It’s worth noting that we’re currently approximately two years from the previous market peak, and from a historical perspective, we could be anywhere from 4 to 6 quarters away from the next peak in this bull market cycle. While historical trends can provide valuable insights into market behavior, it’s important to acknowledge that past performance does not guarantee future results.
We could get a 15-20% correction in the small cap index and that’s a regular occurrence one has to ride through if you want to create real wealth through investment. If we had a combination of a euphoric market and a heated economy, that’s generally the riskiest time in the market. In such a scenario, the probability of a crash (30-50% correction) is high and during such times taking a tactical under allocation call to small caps or equities in general may make more sense.
During the FY02-08 cycle, corporate earnings CAGR was 32%. That cycle was driven by big government capex, private capex, real estate, commodities and global growth. Over the last two terms of this government, the earnings growth (CAGR) has been around 10%. The first term was spent on reviving our economy from a very tough fiscal position, cleaning up the banking system, understanding the problem areas and setting up the platform for growth. The second term focused on rolling out big growth reforms but was also spent on managing COVID crisis. India and our corporates have emerged much stronger from the crisis managing inflation and fiscal position commendably.
We believe that the government has a strong launch pad for aggressive growth policies during the third term. They have been showing the aggression in capex spending growing at 25% plus CAGR over the last 3 years. If one travels across India, the pace, breadth and quantum of infrastructure build up is extraordinary. Private capex is also showing signs of pickup in recent times. The reforms and capex (which come with a lag) over the last few years should deliver growth over the next few years.
Earnings growth during the post COVID period has sustained above 20% (including during the latest quarter) for the overall corporates. Over the next 5 years, we believe it won’t be unreasonable to expect 15 to 20% earnings growth which is approximately half compared to the FY02-08 growth. If you are a good stock picker, you may be able to find companies that can grow earnings at much higher rate than the market.
The markets may be aided with additional factors such as:
→ Foreign portfolio investor (FPI) ownership (currently at historical lows at around 16%) reversing the downward trend towards historical peak of around 21%
→ Government’s aggression in protecting domestic industries and promoting self-reliance
→ Exciting new generation of competent entrepreneurs looking for global business opportunities from India
→ Huge amount of risk (growth) capital available for companies looking for it. Many promoters have diluted their stake and their family offices are a big source of growth capital to smaller companies
→ Cost of capital for Indian companies today is close to global levels and the banking system is robust to support future growth
→ Global interest rates and US dollar index may have peaked. Indian market returns have been inversely proportionate to the dollar index as I had presented in our Sep 2020 memo
Our Strategy in Such Environment
In an environment where opportunities look promising over the long term, but there is fear of a correction in the short term, the best way to ride such uncertainty is by investing in companies where the certainty of earnings growth is very high and valuations are reasonable. Earnings growth is the best defensive strategy available to an investor and where one can have some control if he/she understands the business in-depth. There is very little control of an investor over the market valuation levels which tend to be very volatile across cycles.
The above strategy has helped us ride through the uncertain environments and market bubbles. Over the last 12 years since we started managing outside capital, the worst drawdown over a three year rolling period for our core portfolio (SCP) has been 11.9%. During the same period, the worst drawdown for our benchmark (Average of Nifty Mid 100 and Nifty Small 100) was 38.7%. Point to point returns at peak can be misleading as historical returns at such times look good for many. One or two years can skew even the long term point to point returns. It’s important to evaluate the returns from the perspective of worst case scenario over a reasonable rolling investment period (3-4 yr for us which is also the duration of an average small cap cycle).
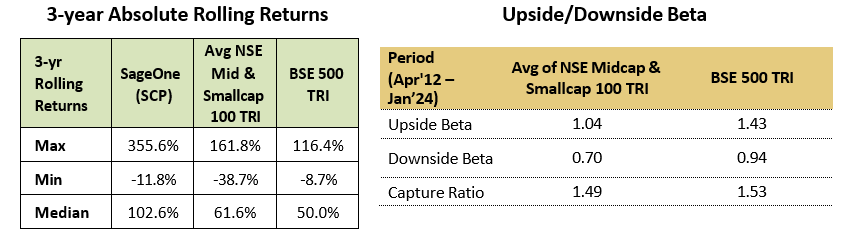
If one happens to invest at the peak of the cycle, what to expect from a downside perspective over your minimum investment horizon. The below table shows 3 year rolling returns calculated at the end of every month for SCP and benchmarks for period March 2012 to January 2024 (106 data points). More than the max or the median, minimum returns reveal the risk in case your timing goes wrong. The adjoining table shows volatility (beta) of SCP during up markets vs down markets. (We have not made the same analysis of our SSP offering since it has performance history of only 5 years so far)
If one is great at timing the markets, you are extraordinarily skilled or lucky. For the others like us, trying to time the markets can be a huge opportunity cost that can make you miss the most rewarding phase of a long bull market. To avoid such risk, the next best option is to protect your capital better than the benchmark during crashes so that you can recover them sooner that the market. All the very best.
Warm Regards,
Samit S. Vartak, CFA
Founder and Chief Investment Officer (CIO)
SageOne Investment Managers LLP
Email: ir@SageOneInvestments.com
Website: www.SageOneInvestments.com

*SageOne Investment Managers LLP is registered as a PMS and an AIF with SEBI.
Appendix
SSP* Portfolio Performance (Net of Fees)
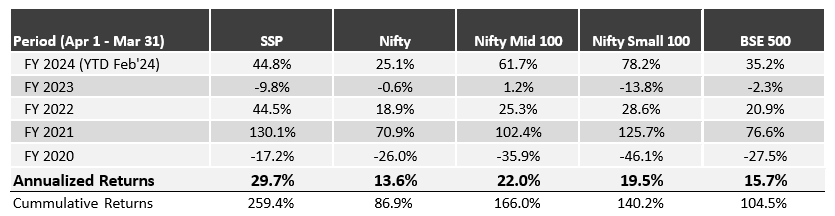
Source: SageOne Investment Managers, Bloomberg, Wealth Spectrum. *SSP is SageOne Small cap Portfolio
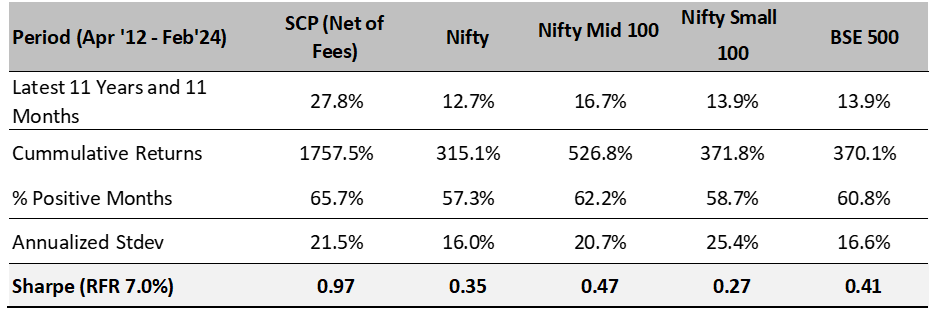
SCP: Latest 11 Years 11 Month Performance (Apr 2012 – Feb 2024)
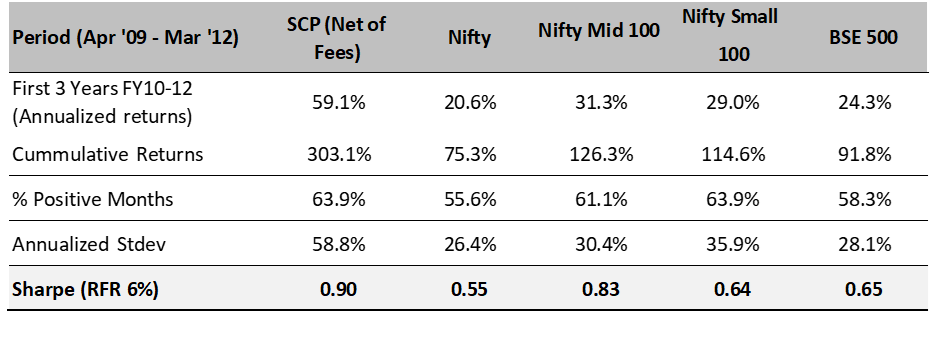
SCP: First 3 Years Performance (Apr 2009 – Mar 2012)
*We have consciously changed the composition of the core portfolio in terms of the average size of companies and the number of stocks in the portfolio after we started advising external clients in April 2012.
*The weighted average size of stocks at the start in FY10 was below $0.25 bn which has increased to nearly $4.6 bn by the end of Feb ’24. Also, the number of stocks has increased from 5 (+/- 2) in 2009 to 16 (+/- 4) during the past 11 years and 11 months.
*Reasonable diversification was done by design to improve liquidity and reduce volatility as a result of which annualized standard deviation has come down from 58.8% for the first 3 years to 21.5% during the last 11 years and 11 months.
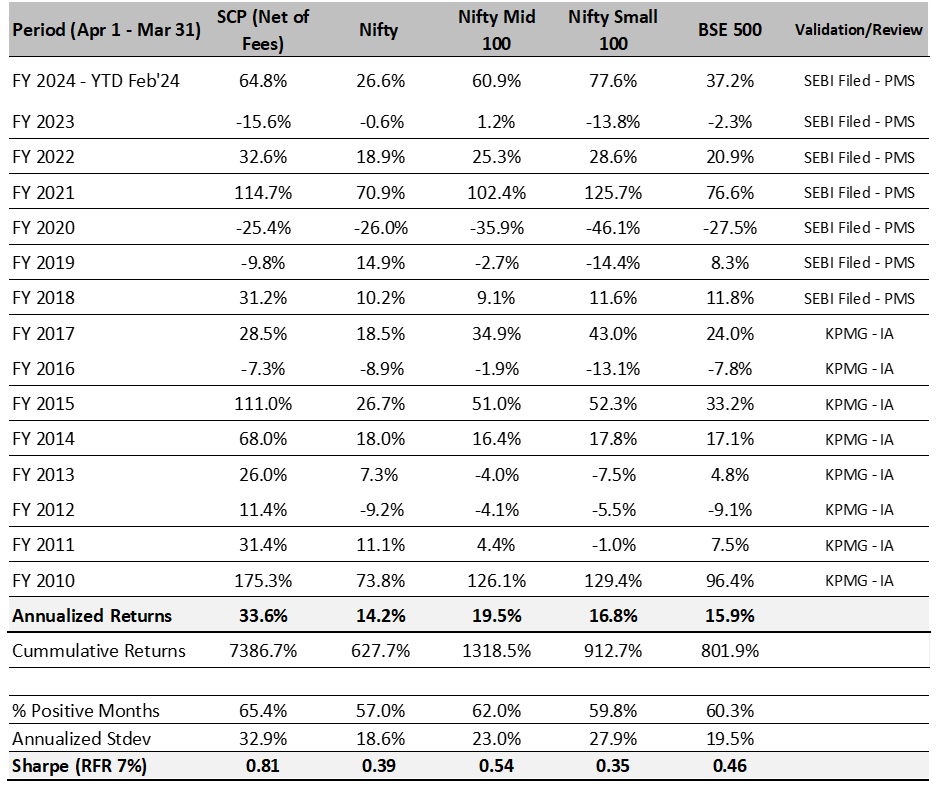
SageOne Core Portfolio (SCP) Performance (Net of Fees)
For the first three years, we managed proprietary funds and for the last 11 years and 1 month we have been advising/managing funds for external clients. Since clients have joined at various stages, individual performance may differ slightly based on the timing of purchases. For uniformity and ease, we measured our IA performance using a “representative” portfolio (that resembles advice given to clients) and we call it SageOne Core Portfolio (SCP). SageOne core portfolio is not a dummy/theoretical portfolio but the CIO’s actual total equity portfolio. The representative portfolio until FY17 was reviewed by KPMG. Post that the performance is for the PMS scheme. Calculated on a TWRR basis for the entire period.
14 Years and 11 Months Performance in INR (Apr 2009 – Feb 2024)
Performance of SageOne AIF Scheme – 1 & 2 (Net of Fees)
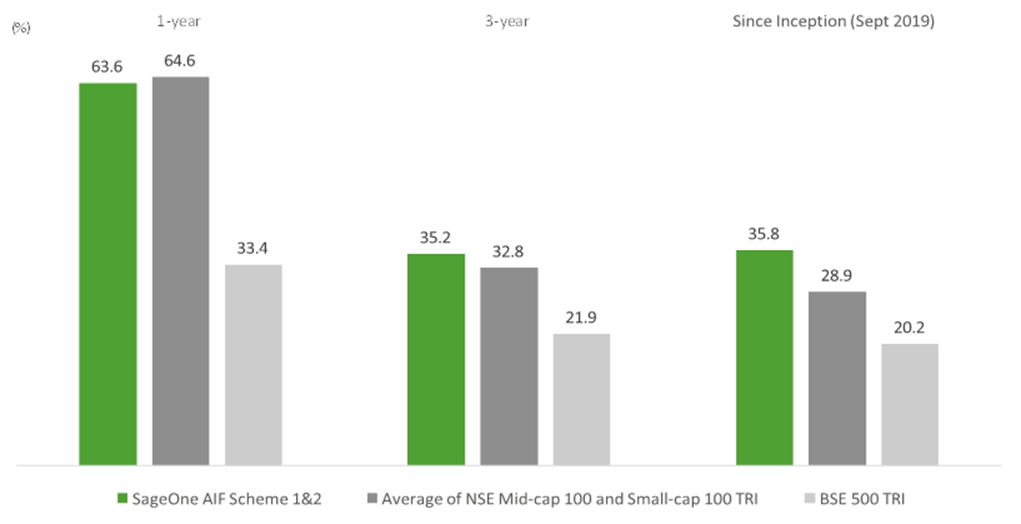
Note: Our AIF is a blend of SCP and SSP. The above data is of SageOne AIF Scheme 1 from Sept’19 to June’22 and of AIF scheme 2 from June’22 till date.
SageOne AIF Scheme 1 was fully redeemed between June’22 to Aug’22 and most investors reinvested the proceeds in Scheme 2. Scheme 2 is closed for new fund raise since Dec’22.
Legal Information and Disclosures
Any performance related information provided above is not verified by SEBI.
This note expresses the views of the author as of the date indicated and such views are subject to changes without notice. SageOne has no duty or obligation to update the information contained herein. Further, SageOne makes no representation, and it should not be assumed, that past performance is an indication of future results.
This note is for educational purposes only and should not be used for any other purpose. The information contained herein does not constitute and should not be construed as an offering of advisory services or financial products. Certain information contained herein concerning economic/corporate trends and performance is based on or derived from independent third-party sources. SageOne believes that the sources from which such information has been obtained are reliable; however, it cannot guarantee the accuracy of such information or the assumptions on which such information is based.