
Dear Investor,
We had two of the toughest years (2020 and 2021) for humanity surprisingly delivering extraordinary returns for the financial investors. This was followed by a relatively normal 2022 being tough for the investors wherein many sectors (including the biggest COVID beneficiaries) gave back significant part of the returns made during the two years. Prime example was the tech (innovative/disruptive) sector in the US. Even in India we witnessed similar (though relatively smaller) reversals in multiple sectors such as chemicals, pharma, IT services, building materials, textiles and many more.
The speed of information dissemination has increased exponentially over the years while information asymmetry across investors has drastically gone down. Changing environment and expectations get priced in very quickly in today’s markets. As a result, an investor gets extremely limited time to react, thereby making the already difficult job of generating alpha furthermore challenging.
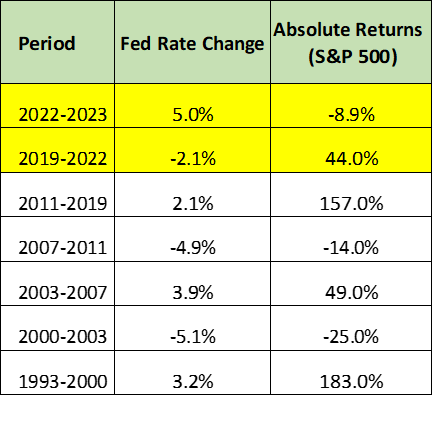
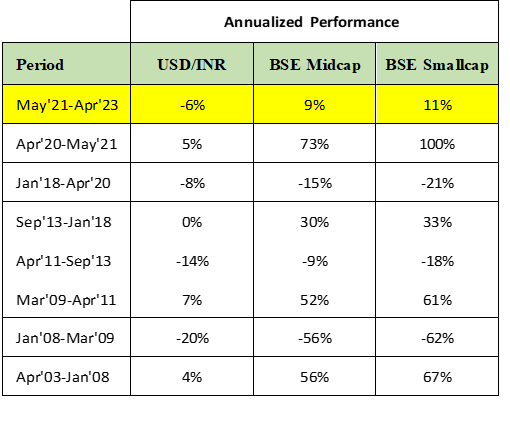
E.g. When GDP was collapsing during peak of COVID, equity markets were hitting all-time highs. In the last 30 years, S&P 500 has always delivered positive returns during a Fed increasing cycle and vice versa, but during the recent cycle markets acted exactly the opposite. Similarly, when INR depreciates against the USD, broader indices have always fallen in the last 20 years. Not so in the recent fall in INR. Investors are acting quickly in anticipation.
Things look very logical in hindsight, but unclear most of the time while they are occurring. We at SageOne also struggled during 2022 not only to deliver positive returns but also to generate alpha. Though underperformance is part of an investment journey, such periods are extremely painful and these are the times when it’s important to etch key new learnings in your process to enable superior returns.
Before I provide my opinion on alpha in the Indian markets, let me provide some context to what we should aspire (opportunity cost) to beat.
Return (CAGR) expectation from the Indian equity markets
The number that gets quoted for long term returns from the Indian markets is around 15%. Actual number varies drastically depending on the start and end point one uses for calculating these returns. E.g. Nifty delivered 5 year (rolling) CAGR of 44% between Oct’02 to Oct’07, while the same was -5% between Jul’97 to Jul’02. I believe that it’s more reliable to look at the median and range of the longer term rolling returns whether you are evaluating an index or a fund manager. Below are the rolling period returns for select Indian indices over the past 20 years (from April’03 to May’23).
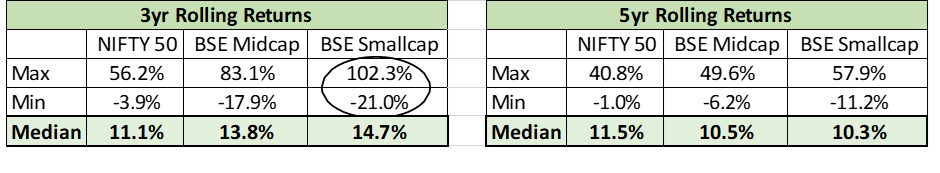
The range of rolling returns is very wide and this gets even wider in the broader markets. The median 5-year rolling return for Nifty is 11.5% (12.5%-13.0% including dividends). Even if you do this analysis over a 30-year time horizon, the results are similar. The median returns are very close to the nominal GDP growth during this period. Unfortunately, the actual returns made by an average investor probably is lower than the median rolling returns as their entries tend to concentrate towards the end of bull cycles.
I can say with reasonable confidence that going forward the long term median rolling returns will be closer to the nominal GDP growth for India which is expected to be in the range of 10% to 13%. Goal of an investor should be to generate returns with alpha of minimum 3%-5% if not higher. The supposedly easy returns of 15% assumed as a given from the Indian indices is not going to be easy unless one achieves this alpha.
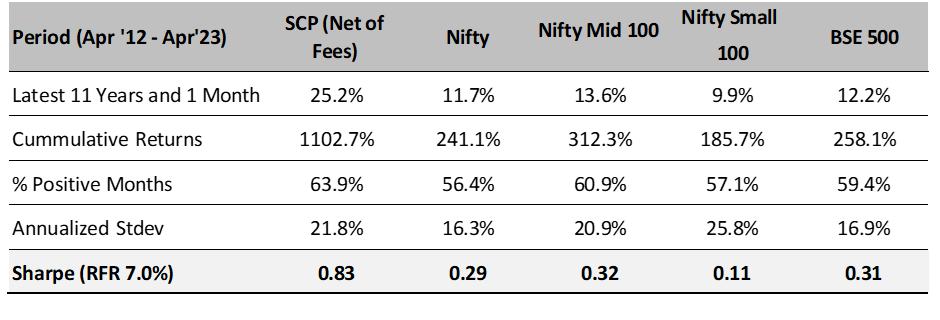
At SageOne too, even if we have delivered 25%+ CAGR since inception 11 years ago, the rolling average range has been wide as can be seen below. The time of entry has a huge bearing on the returns. Below are numbers since March 2012 for our core portfolio (SCP) as well as other indices.
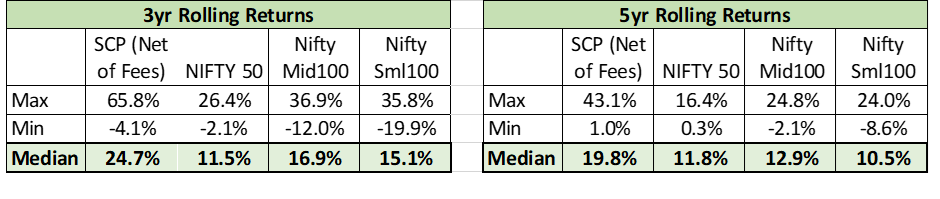
The above analysis shows how cyclical the returns are especially in the broader markets. If that’s the case, can we take advantage of these cycles to enhance our returns and more importantly to reduce large drawdowns by avoiding entries closer to the peak.
How Cycles have worked in the broader markets?
“Equities is a risky asset class and when one invests in the markets, one should come in with a long term horizon. This horizon can range from 3 to 10 years or ideally forever.” This is a very common and prudent advice given by experts. In this theory, time of entry is irrelevant and probably is a valid argument once you stretch the horizon to few decades.
For majority of investors, such a time horizon is beyond their patience to keep holding when the portfolio is under losses or underperforming the benchmark for years. It is even more difficult for many investors who invest in small or midcap companies in an expectation of making quicker and higher returns. This space is very volatile, which is showcased by average drawdowns (peak to next bottom) of 45% for the Nifty small cap 100 index over the last 5 cycles since 2005.
What makes it even more difficult for investors is that they try to time the markets, but tend to enter near the end of a bull run when everyone is bullish and confidence in equities is very high. In such an environment, most often after the initial quick profits, the portfolios suffer massive losses. The long term journey ends within a short term. The end result is that the actual returns made by majority of investors are significantly lower than what’s delivered by the indices.
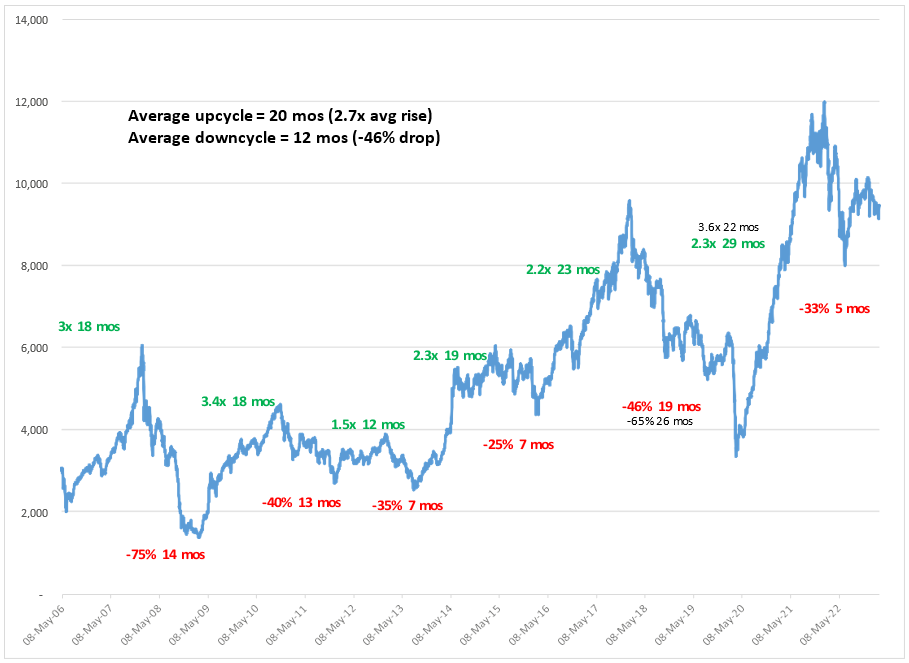
Relevant question, from the point of view of an investor who is trying to venture in the small cap space is, can we do something tactical to improve the returns and reduce volatility in the portfolio. Effectively can we improve the effectiveness of timing? There have been 5 sharp drops in the Nifty small cap 100 index over the past 15 years. While the drops have averaged 45%, the bounce backs have also been sharp from the bottom averaging 2.7x as represented in the following graph.
Source: NSE website
Note: During the COVID cycle, we have mentioned 2 data line items. This is because in reality the cycle had turned before COVID hit, but got extended. Two data points are for drop and jump with and without COVID drawdown.
The cycles have lasted for an average of 32 months within which the average fall has lasted for 12 months and the average rise for 20 months. Previous peaks were in 2008, 2011, 2014, 2017 and 2021. These were represented by
- Bullish sentiments with huge retail inflow in direct equity
- Valuation gap between large caps and small caps narrow sharply
I believe, even though it may not be possible to time the peaks and troughs exactly, investors can take tactical advantage to reduce their probability of getting the timing exactly wrong and improve their chances of generating superior returns. You also don’t have to play the 0 or 1 game, but make tactical changes in allocation depending on your individual risk appetite. E.g. if your allocation to small cap space is X on an average, make it say 0.75X when factors A and B above hold true and evaluating where you are in the 3-year cycle. If it’s been more than 2.5 years since the previous peak, it’s more likely nearing another peak.
You can increase the allocation to 1.25X when factors A and B are absent and it’s been just 7 to 12 months since the previous peak (more likely to be closer to trough). Just these small adjustments can help reduce sharp losses and more importantly reduce stress. In addition, you will have nice dry powder to allocate when stocks are down 30-40%. From the peak to trough, 100 becomes 55 (45% average drawdown). From 55, the average jump has been 2.7x which is roughly 150. Unfortunately, investors generally don’t have any incremental funds at this point, but imagine the returns (172%) on funds added at 55. Of course exact entry and exit is impossible, but partial advantage can also add significantly to your returns.
How is the broader market positioned currently? I believe currently the small cap space is closer to the second scenario compared to the first. Previous peak was at the end of 2021 and if history was to be used as a guide, we may have the next peak towards end of 2024 or in 2025. During this fall, the peak drawdown was about 33%, which is lower than average and hence it’s possible that the rise from bottom could also be relatively lower. This seems logical and easy, but I wish investment was this straight forward. Markets have the habit of throwing a surprise at us very often and we should not take this for granted but be ready to adapt if and when environment changes.
Further thoughts on Alpha generation in the Indian Markets
Small/mid cap space is more volatile than the large indices and in the earlier part of this memo we touched upon ways to make volatility our friend rather than our enemy. If one doesn’t want to consider timing, it’s prudent to spread (SIP) the investments over time so that you get to buy at peaks as well as troughs.
As discussed earlier, even though many advantages for select few investors have narrowed significantly over time, there are many factors that still are as relevant as ever.
1. Good Old Stock Picking
Stock picking ability of finding great businesses early when markets and institutional analysts aren’t aware of them is still one of the biggest advantages. Most such opportunities are found in the small/mid cap space, which is relatively inefficient, and once in a while one can find very attractively priced stocks. This ability is developed over many years with great efforts by studying and experiencing cycles in many businesses and sectors.
2. Betting Big
Once you find an attractive idea, unless you bet big on it, the alpha generation will remain limited. There is no short cut to developing conviction, but to understand the business as in depth as you can. Finding just 2 or 3 such ideas in a 3 to 4-year cycle and betting big (8-10% allocation) on each can take care of most of the alpha. Of course the remaining stocks should not be disasters, but deliver close to market returns.
3. Temperament
A large (10x plus) multi bagger idea goes through many sharp drawdowns in its journey. To hold on during such periods needs strong temperament and conviction (again). Markets often scare you out of great long term ideas, and without temperament your journey in them would be short lived.
4. Being Contrarian
As a fund manager with large funds to deploy, the impact cost (entry and exit) can eat away any alpha possibility even if you are able to find a great idea. Impact cost is high if you are betting on a consensus story and are not earlier than others. It’s very common to see 30- 40% jumps or drops in just a few days. To reduce impact cost, it’s becoming critical to be contrarian when competition while buying/selling is very low.
5. Macros?
Some investors are good at macros, but again it boils down to either timing the markets or timing buying into a theme or a sector. This is not that easy for most. Recently veteran macro investor Stanley Druckenmiller noted in an interview that currently the macro factors are the most confusing in his 4 decade plus career. If he finds it confusing and difficult, others surely will find it as difficult. There are investors who do it relatively well over many cycles.
There are many other factors which exits, but I have listed the ones that I find more relevant for our style of investing. It’s not necessary or possible that each of us have all the skills. It’s important to understand our own strengths and accordingly match an investment style where you can deliver superior returns.
All the very best for your future journey of wealth creation.
Warm Regards,
Samit S. Vartak, CFA
Founder and Chief Investment Officer (CIO)
SageOne Investment Managers LLP
Email: ir@SageOneInvestments.com
Website: www.SageOneInvestments.com

*SageOne Investment Managers LLP is registered as a PMS and an AIF with SEBI.
Appendix
SSP* Portfolio Performance (Net of Fees)
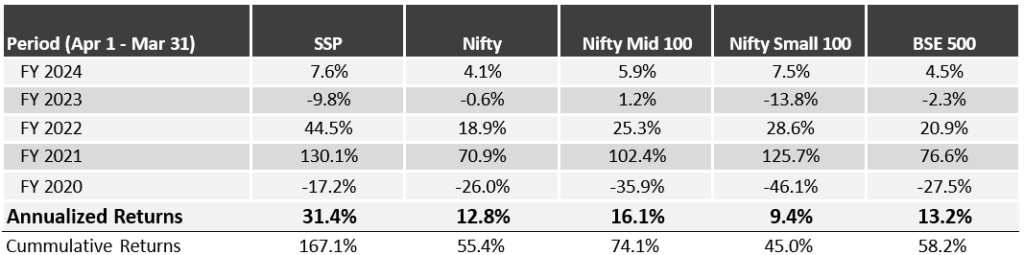
Source: SageOne Investment Managers, Bloomberg, Wealth Spectrum. *SSP is SageOne Small cap Portfolio
SCP: Latest 11 Years 1 Month Performance (Apr 2012 – Apr 2023)
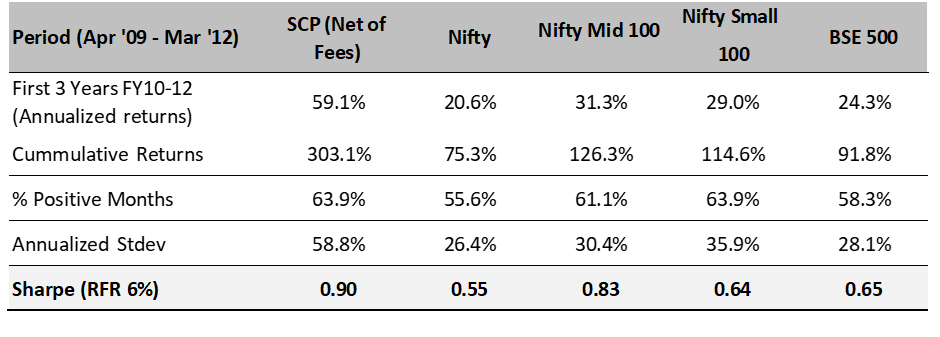
SCP: First 3 Years Performance (Apr 2009 – Mar 2012)
*We have consciously changed the composition of the core portfolio in terms of the average size of companies and the number of stocks in the portfolio after we started advising external clients in April 2012.
*The weighted average size of stocks at the start in FY10 was below $0.25 bn which has increased to nearly $2.5 bn by the end of Apr ’23. Also, the number of stocks has increased from 5 (+/- 2) in 2009 to 15 (+/- 2) during the past 11 years and 1 month.
*Reasonable diversification was done by design to improve liquidity and reduce volatility as a result of which annualized standard deviation has come down from 59% for the first 3 years to 22% during the last 11 years and 1 month.
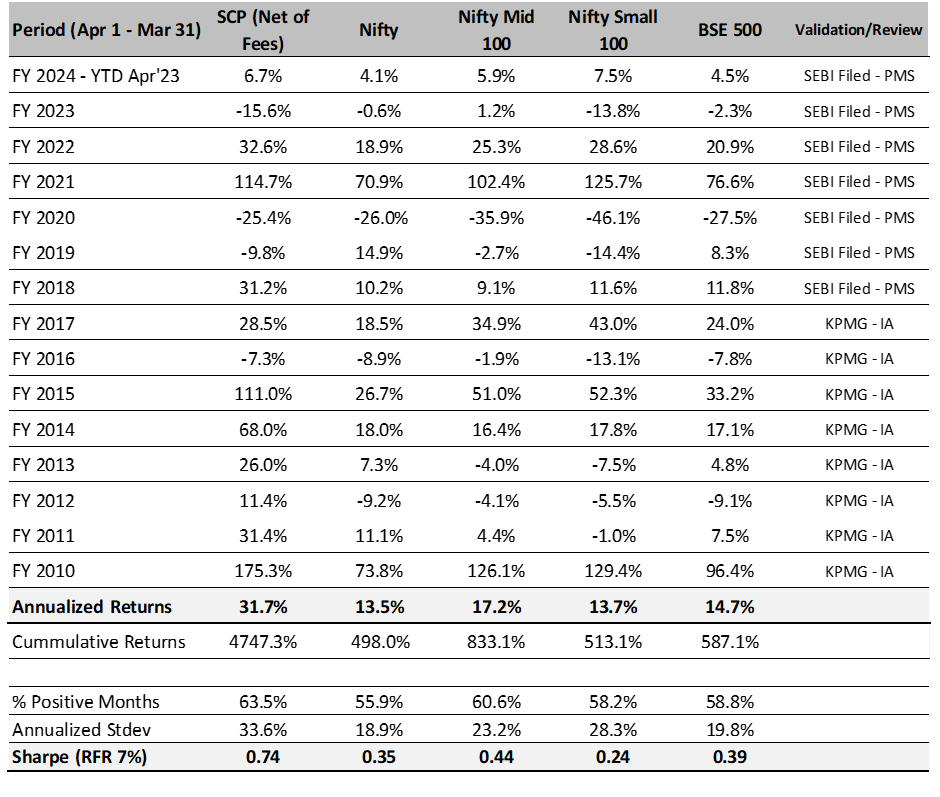
SageOne Core Portfolio (SCP) Performance (Net of Fees)
For the first three years, we managed proprietary funds and for the last 11 years and 1 month we have been advising/managing funds for external clients. Since clients have joined at various stages, individual performance may differ slightly based on the timing of purchases. For uniformity and ease, we measured our IA performance using a “representative” portfolio (that resembles advice given to clients) and we call it SageOne Core Portfolio (SCP). SageOne core portfolio is not a dummy/theoretical portfolio but the CIO’s actual total equity portfolio. The representative portfolio until FY17 was reviewed by KPMG. Post that the performance is for the PMS scheme. Calculated on a TWRR basis for the entire period.
14 Years and 1 Month Performance in INR (Apr 2009 – Apr 2023)
Legal Information and Disclosures
Any performance related information provided above is not verified by SEBI.
This note expresses the views of the author as of the date indicated and such views are subject to changes without notice. SageOne has no duty or obligation to update the information contained herein. Further, SageOne makes no representation, and it should not be assumed, that past performance is an indication of future results.
This note is for educational purposes only and should not be used for any other purpose. The information contained herein does not constitute and should not be construed as an offering of advisory services or financial products. Certain information contained herein concerning economic/corporate trends and performance is based on or derived from independent third-party sources. SageOne believes that the sources from which such information has been obtained are reliable; however, it cannot guarantee the accuracy of such information or the assumptions on which such information is based.